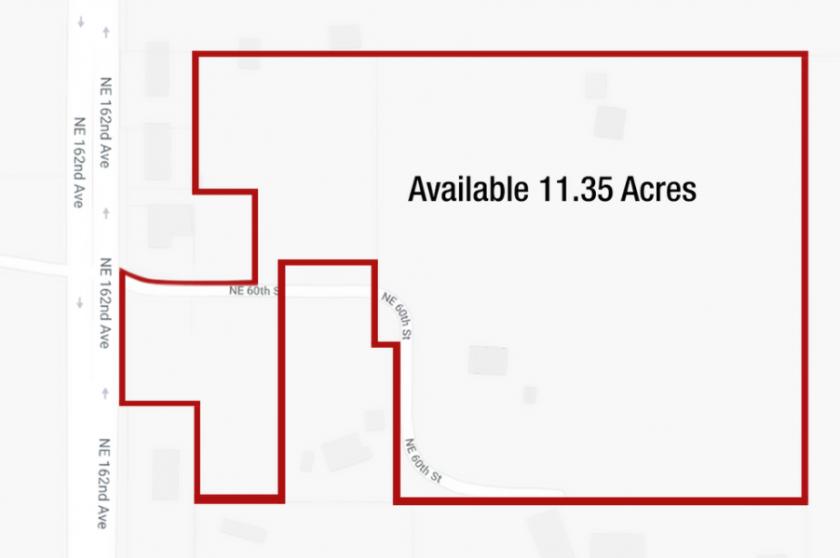
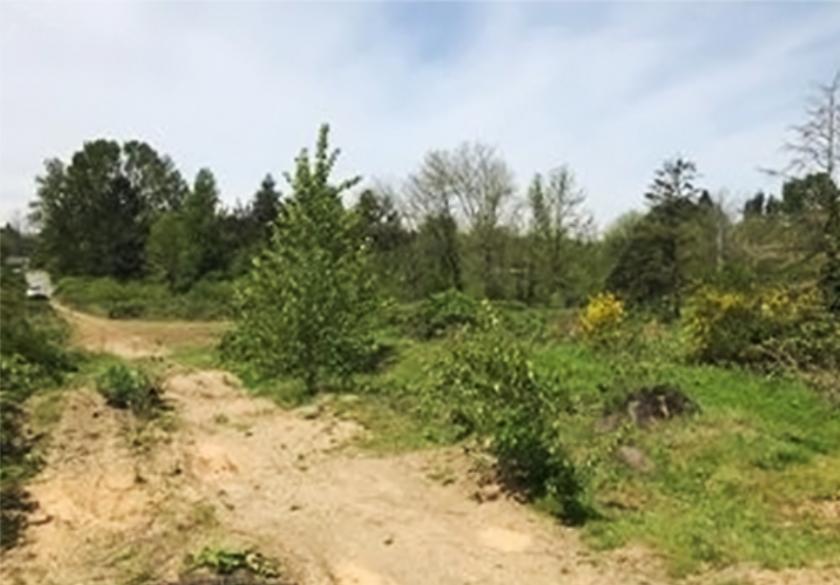
1-Mile | 3-Miles | 5-Miles | ||
---|---|---|---|---|
Total Population | 6,012 | 77,393 | 183,439 | |
Population Median Age | 35 | 36 | 38 | |
Population by Age | 0-9 Yrs | 710 (11%) | 10485 (13%) | 23919 (13%) |
10-19 Yrs | 1159 (19%) | 11583 (14%) | 24959 (13%) | |
20-29 Yrs | 648 (10%) | 10536 (13%) | 25860 (14%) | |
30-39 Yrs | 767 (12%) | 11036 (14%) | 24710 (13%) | |
40-49 Yrs | 1056 (17%) | 10723 (13%) | 24890 (13%) | |
50-59 Yrs | 891 (14%) | 9743 (12%) | 21987 (11%) | |
60-69 Yrs | 504 (8%) | 7832 (10%) | 19495 (10%) | |
70+ Yrs | 277 (4%) | 5455 (7%) | 17618 (9%) | |
Median HH Income | $87,905 | $75,361 | $69,912 | |
Total Household Income | < 24K | 152 (7%) | 2731 (10%) | 8679 (12%) |
25-49K | 225 (11%) | 4968 (18%) | 14109 (20%) | |
50-74K | 356 (18%) | 5514 (20%) | 14190 (20%) | |
75-99K | 433 (22%) | 4647 (17%) | 10261 (15%) | |
100-199K | 619 (32%) | 7227 (27%) | 17264 (25%) | |
200K+ | 128 (6%) | 1474 (5%) | 3669 (5%) | |
Highest Education Level | No Diploma | 190 | 3949 | 9852 |
Diploma or GED | 988 | 13618 | 31857 | |
Some College | 1171 | 14453 | 33939 | |
Assoc. Degree | 391 | 5655 | 13371 | |
Bachelors Degree | 652 | 8622 | 23070 | |
Higher Degree | 371 | 3824 | 10726 | |
Total Housing Units | 1,981 | 27,487 | 70,800 | |
--Owner-Occupied | 1,575 | 19,025 | 42,235 | |
--Renter-Occupied | 339 | 7,536 | 25,937 | |
Owner-Occupied Values | < 100K | 23 | 1167 | 1862 |
100-199K | 118 | 2121 | 4890 | |
200-299K | 684 | 7324 | 15423 | |
300-399K | 474 | 5005 | 11659 | |
400-499K | 118 | 1901 | 4607 | |
500K+ | 160 | 1507 | 3794 | |
Total Working Age Population | 4,592 | 59,661 | 144,316 | |
In Work Force | 3,181 | 41,563 | 95,736 | |
Not In Work Force | 1,411 | 18,098 | 48,580 | |
Workforce Employed | 2,978 | 39,193 | 90,374 | |
Workforce Unemployed | 195 | 2,323 | 5,119 | |
Civlian Workforce | 3,173 | 41,515 | 95,493 | |
Military Workforce | 8 | 47 | 243 | |
Total Households | 1,914 | 26,560 | 68,172 | |
Family Households | 1,499 | 19,293 | 45,939 | |
Non-Family Households | 415 | 7,267 | 22,233 | |
Married Couple | 1,167 | 14,889 | 34,994 | |
Other Family | 333 | 4,405 | 10,946 | |
Married w/Child | 585 | 6,635 | 14,834 | |
Single Male w/Child | 54 | 712 | 1,623 | |
Single Female w/Child | 90 | 1,655 | 4,371 |
Population Change Last Two Decades - Plus Projection
2000 | % | 2010 | % | 2020 | % | 2030 | |
---|---|---|---|---|---|---|---|
Oregon | 3,421,399 | +12 | 3,831,074 | +11 | 4,264,810 | +11 | 4,727,438 |
Multnomah County | 660,486 | +11 | 735,334 | +12 | 822,675 | +10 | 906,904 |
Washington | 5,894,121 | +14 | 6,724,540 | +14 | 7,638,415 | +11 | 8,503,178 |
Clark County | 345,238 | +23 | 425,363 | +17 | 499,400 | +16 | 576,879 |
Total Working Age Population:
Total Households:
Total Working Age Population:
Total Households:
Total Working Age Population:
Total Households: