Office Space
1 Center Street Travelers Rest, SC 29690
1 Center Street Travelers Rest, SC 29690

Details & Description
Property Highlights
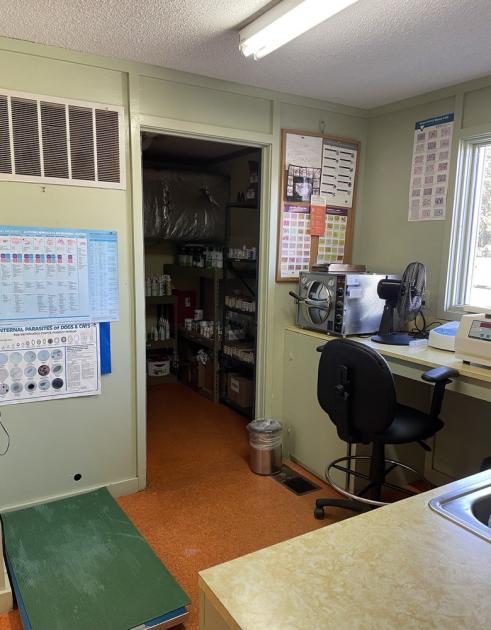
- • Established Practice with Real Estate
- • Room for Expansion
- • Reputable, Well Respected Practice
- • Economic Growth Area
- • Holistic Practice with Traditional Medicine
Listing Agents

Brent Edgerton
O: 864-422-9510
M: 864-979-0335
brente@kw.com
O: 864-422-9510
M: 864-979-0335
brente@kw.com
While we strive to provide the most accurate information, all listing information, and demographic data, is provided by third-parties. As such, MyEListing will not be responsible for the accuracy of the information. It is strongly recommended that you verify all information with the listing agent, and any relevant agencies, prior to making any decisions.