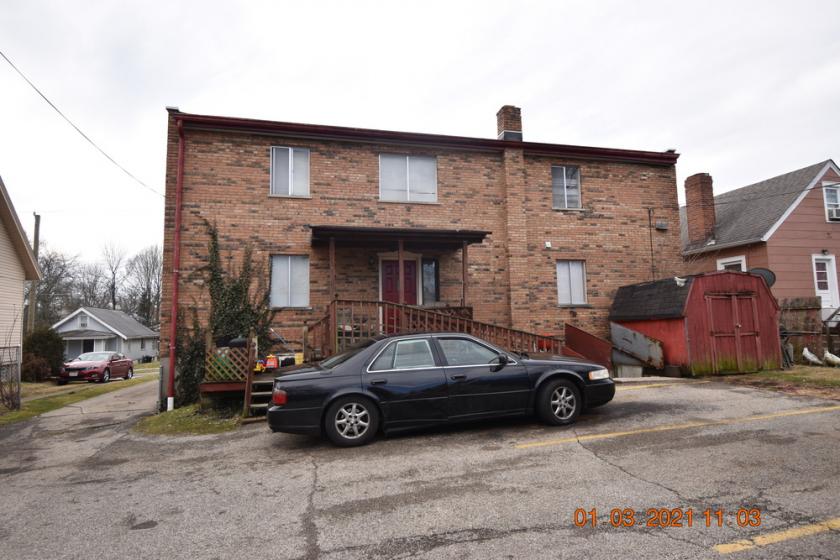
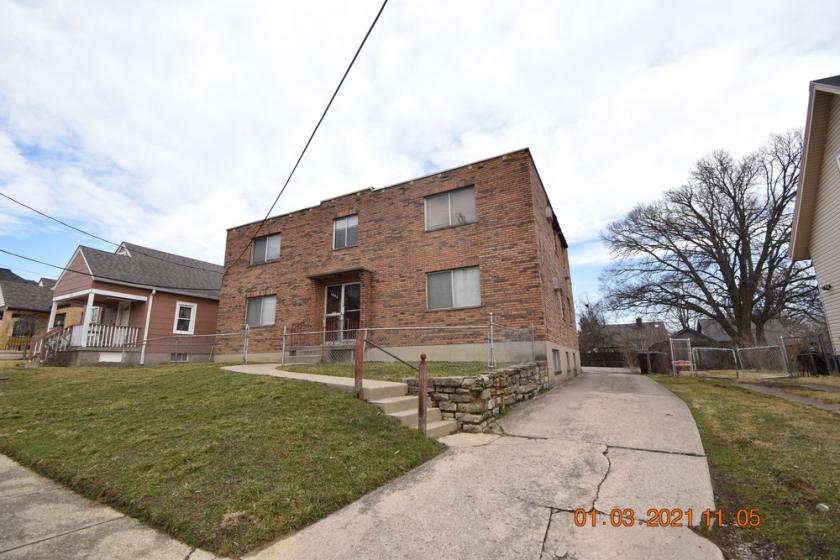
1-Mile | 3-Miles | 5-Miles | ||
---|---|---|---|---|
Total Population | 14,739 | 99,465 | 209,112 | |
Population Median Age | 38 | 39 | 39 | |
Population by Age | 0-9 Yrs | 1910 (12%) | 13600 (13%) | 29267 (13%) |
10-19 Yrs | 1925 (13%) | 12690 (12%) | 26596 (12%) | |
20-29 Yrs | 1979 (13%) | 12284 (12%) | 27084 (12%) | |
30-39 Yrs | 1851 (12%) | 12311 (12%) | 26526 (12%) | |
40-49 Yrs | 1966 (13%) | 11310 (11%) | 23431 (11%) | |
50-59 Yrs | 2089 (14%) | 14456 (14%) | 29557 (14%) | |
60-69 Yrs | 1803 (12%) | 12465 (12%) | 24988 (11%) | |
70+ Yrs | 1216 (8%) | 10347 (10%) | 21663 (10%) | |
Median HH Income | $45,677 | $50,510 | $52,493 | |
Total Household Income | < 24K | 1891 (30%) | 10815 (25%) | 22618 (26%) |
25-49K | 1504 (24%) | 9870 (23%) | 19192 (22%) | |
50-74K | 1280 (20%) | 8419 (20%) | 16373 (18%) | |
75-99K | 683 (11%) | 5331 (12%) | 10394 (11%) | |
100-199K | 695 (11%) | 6476 (15%) | 15099 (17%) | |
200K+ | 72 (1%) | 809 (1%) | 3312 (3%) | |
Highest Education Level | No Diploma | 1057 | 6660 | 13691 |
Diploma or GED | 3627 | 22288 | 43400 | |
Some College | 2190 | 15619 | 30449 | |
Assoc. Degree | 1216 | 6946 | 14143 | |
Bachelors Degree | 1395 | 10727 | 24774 | |
Higher Degree | 621 | 5497 | 15071 | |
Total Housing Units | 6,671 | 45,425 | 95,787 | |
--Owner-Occupied | 3,417 | 25,360 | 51,472 | |
--Renter-Occupied | 2,709 | 16,359 | 35,515 | |
Owner-Occupied Values | < 100K | 2182 | 10455 | 18000 |
100-199K | 955 | 12272 | 23095 | |
200-299K | 178 | 1815 | 5945 | |
300-399K | 26 | 333 | 2225 | |
400-499K | 4 | 130 | 929 | |
500K+ | 71 | 356 | 1278 | |
Total Working Age Population | 11,559 | 77,593 | 162,627 | |
In Work Force | 7,769 | 50,932 | 107,240 | |
Not In Work Force | 3,791 | 26,661 | 55,387 | |
Workforce Employed | 7,145 | 47,950 | 100,724 | |
Workforce Unemployed | 624 | 2,982 | 6,474 | |
Civlian Workforce | 7,769 | 50,932 | 107,197 | |
Military Workforce | 0 | 0 | 43 | |
Total Households | 6,126 | 41,719 | 86,987 | |
Family Households | 3,448 | 25,150 | 52,894 | |
Non-Family Households | 2,678 | 16,569 | 34,094 | |
Married Couple | 1,656 | 14,438 | 32,159 | |
Other Family | 1,792 | 10,712 | 20,734 | |
Married w/Child | 547 | 4,727 | 10,752 | |
Single Male w/Child | 134 | 987 | 1,975 | |
Single Female w/Child | 767 | 5,073 | 10,384 |
Population Change Last Two Decades - Plus Projection
2000 | % | 2010 | % | 2020 | % | 2030 | |
---|---|---|---|---|---|---|---|
Ohio | 11,353,140 | +2 | 11,536,504 | 0 | 11,574,870 | 0 | 11,615,100 |
Hamilton County | 845,303 | -5 | 802,374 | -1 | 790,600 | -1 | 785,900 |
Total Working Age Population:
Total Households:
Total Working Age Population:
Total Households:
Total Working Age Population:
Total Households: