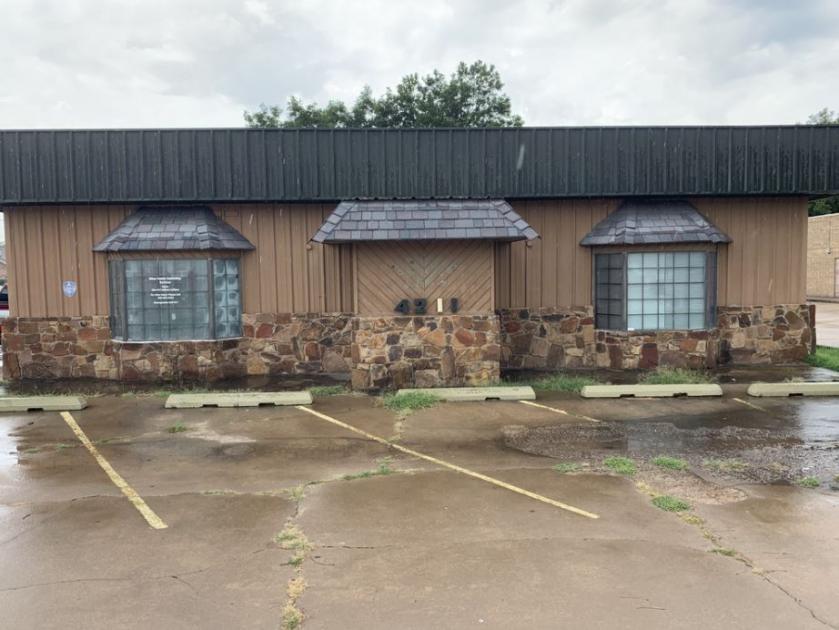
Retail Space
4211 North Macarthur Boulevard Warr Acres, OK 73122
4211 North Macarthur Boulevard Warr Acres, OK 73122
Details & Description
Property Highlights
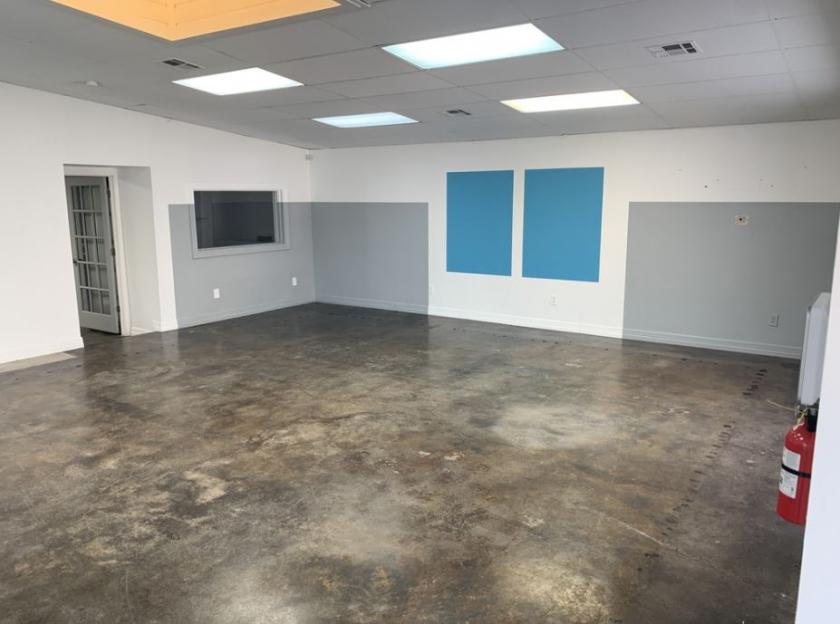
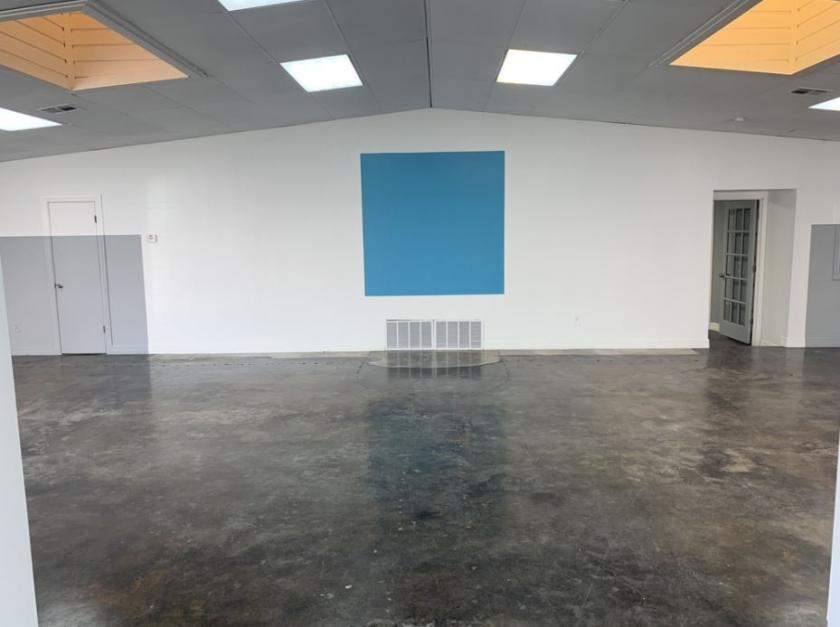
- • 2,500 SF Building 1,350 MOL Greenhouse attached
- • 3 Offices
- • 2 Restrooms
- • Stained Concrete Floor
- • 10 Shop Door
- • Security System
Additional Photos

Listing Agents

Brent Holliday
O: 405-948-7500
M: 405-788-1708
brenth@kwcommercial.com
O: 405-948-7500
M: 405-788-1708
brenth@kwcommercial.com
While we strive to provide the most accurate information, all listing information, and demographic data, is provided by third-parties. As such, MyEListing will not be responsible for the accuracy of the information. It is strongly recommended that you verify all information with the listing agent, and any relevant agencies, prior to making any decisions.


