Specialty Real Estate
18 South Central Avenue Idabel, OK 74745
18 South Central Avenue Idabel, OK 74745
Details & Description
Property Highlights
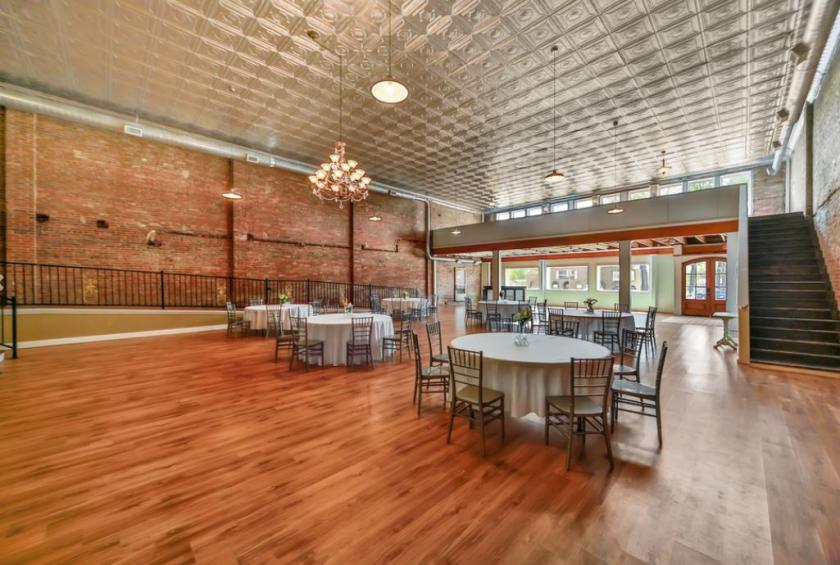
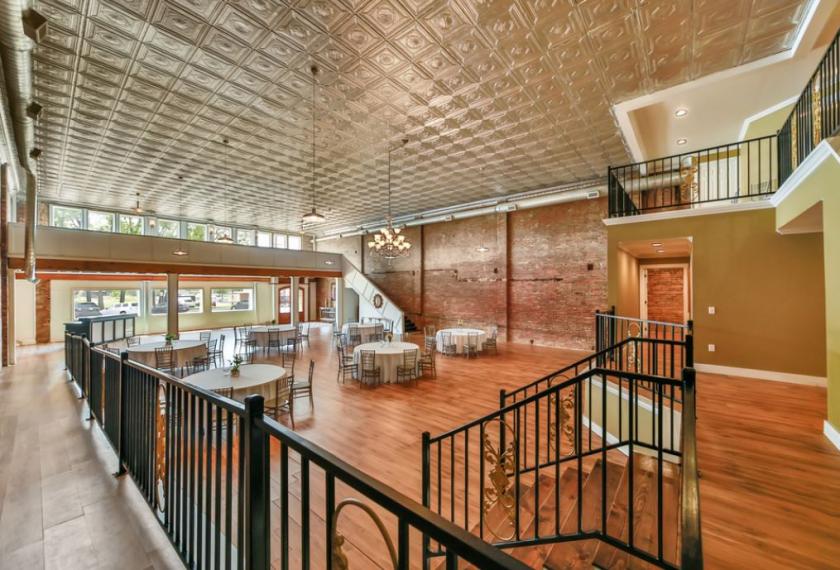
- • Unique Event Venue
- • Ample space for events of all kinds
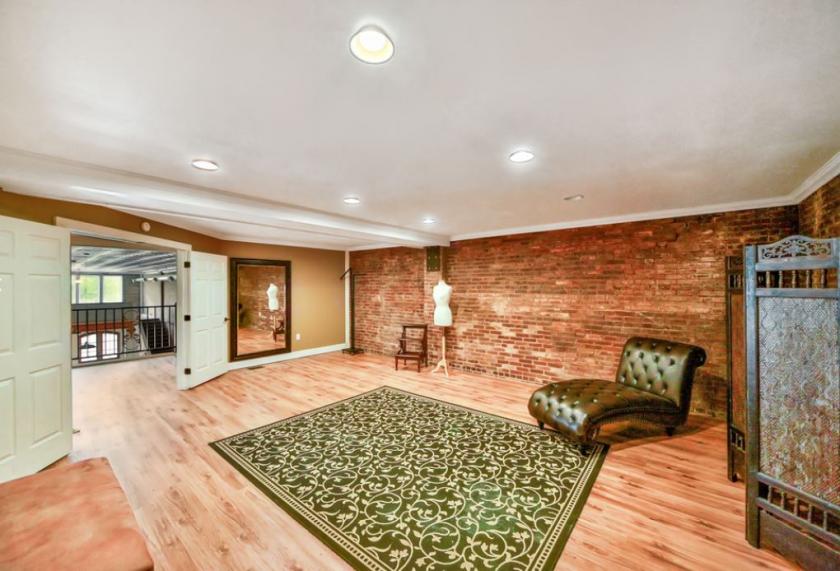
- • Updated interior finishes
- • Located in the heart of Downtown Idabel
Additional Photos

Listing Agents

Brent Holliday
O: 405-948-7500
M: 405-788-1708
brenth@kwcommercial.com
O: 405-948-7500
M: 405-788-1708
brenth@kwcommercial.com
While we strive to provide the most accurate information, all listing information, and demographic data, is provided by third-parties. As such, MyEListing will not be responsible for the accuracy of the information. It is strongly recommended that you verify all information with the listing agent, and any relevant agencies, prior to making any decisions.


