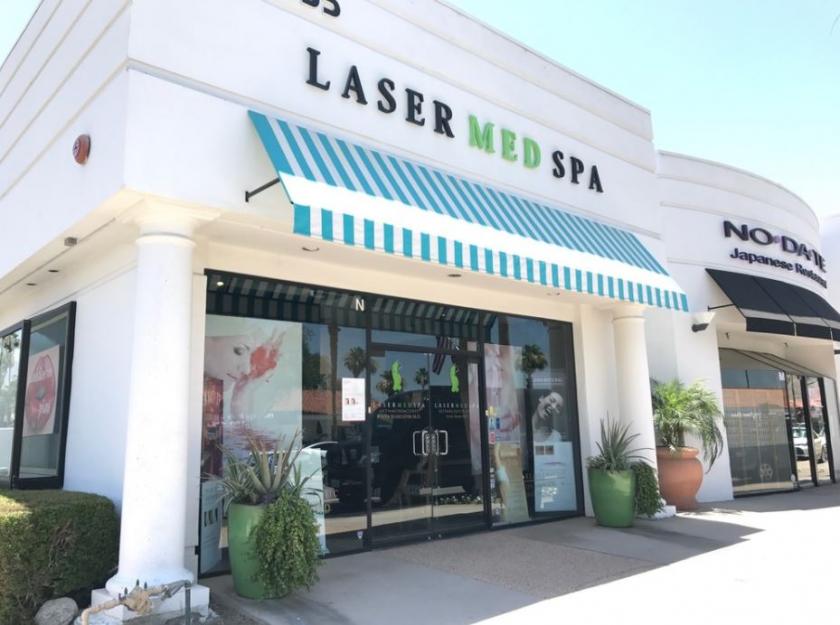
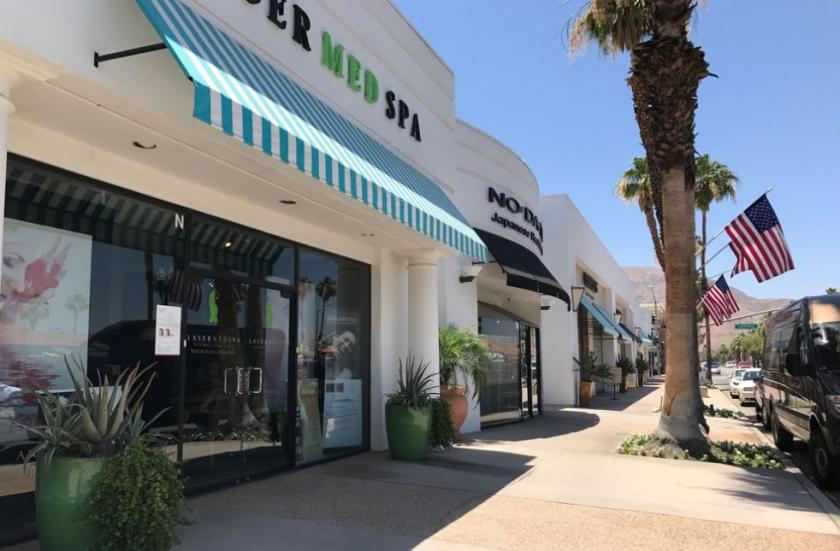
1-Mile | 3-Miles | 5-Miles | ||
---|---|---|---|---|
Total Population | 11,714 | 40,365 | 73,521 | |
Population Median Age | 44 | 50 | 52 | |
Population by Age | 0-9 Yrs | 757 (6%) | 2561 (6%) | 4902 (6%) |
10-19 Yrs | 1431 (12%) | 3672 (9%) | 5613 (7%) | |
20-29 Yrs | 1752 (14%) | 4268 (10%) | 6593 (8%) | |
30-39 Yrs | 1258 (10%) | 3289 (8%) | 5943 (8%) | |
40-49 Yrs | 1314 (11%) | 3701 (9%) | 6656 (9%) | |
50-59 Yrs | 1496 (12%) | 5108 (12%) | 8935 (12%) | |
60-69 Yrs | 1603 (13%) | 6640 (16%) | 12742 (17%) | |
70+ Yrs | 2102 (17%) | 11127 (27%) | 22135 (30%) | |
Median HH Income | $50,954 | $61,898 | $64,396 | |
Total Household Income | < 24K | 1204 (24%) | 3867 (20%) | 7021 (20%) |
25-49K | 1166 (24%) | 3777 (20%) | 7099 (20%) | |
50-74K | 868 (17%) | 3093 (16%) | 5577 (16%) | |
75-99K | 561 (11%) | 2006 (10%) | 3613 (10%) | |
100-199K | 767 (15%) | 3821 (20%) | 7403 (21%) | |
200K+ | 260 (5%) | 1955 (10%) | 4002 (11%) | |
Highest Education Level | No Diploma | 831 | 2532 | 4095 |
Diploma or GED | 2160 | 6302 | 11367 | |
Some College | 2453 | 8386 | 16137 | |
Assoc. Degree | 596 | 2470 | 4538 | |
Bachelors Degree | 1681 | 7664 | 14227 | |
Higher Degree | 830 | 4575 | 9513 | |
Total Housing Units | 6,664 | 30,163 | 58,118 | |
--Owner-Occupied | 2,339 | 11,941 | 23,462 | |
--Renter-Occupied | 2,487 | 6,578 | 11,254 | |
Owner-Occupied Values | < 100K | 127 | 533 | 1308 |
100-199K | 192 | 1023 | 1788 | |
200-299K | 627 | 2408 | 4389 | |
300-399K | 462 | 2204 | 4565 | |
400-499K | 300 | 1832 | 3582 | |
500K+ | 631 | 3942 | 7831 | |
Total Working Age Population | 10,118 | 35,464 | 65,097 | |
In Work Force | 5,595 | 17,263 | 30,352 | |
Not In Work Force | 4,523 | 18,201 | 34,745 | |
Workforce Employed | 5,407 | 16,416 | 28,675 | |
Workforce Unemployed | 189 | 848 | 1,677 | |
Civlian Workforce | 5,595 | 17,263 | 30,352 | |
Military Workforce | 0 | 0 | 0 | |
Total Households | 4,826 | 18,519 | 34,716 | |
Family Households | 2,550 | 10,434 | 19,614 | |
Non-Family Households | 2,276 | 8,085 | 15,101 | |
Married Couple | 1,838 | 8,360 | 16,083 | |
Other Family | 712 | 2,074 | 3,531 | |
Married w/Child | 621 | 1,852 | 3,201 | |
Single Male w/Child | 141 | 309 | 513 | |
Single Female w/Child | 121 | 481 | 844 |
Population Change Last Two Decades - Plus Projection
2000 | % | 2010 | % | 2020 | % | 2030 | |
---|---|---|---|---|---|---|---|
California | 33,871,648 | +10 | 37,253,956 | +9 | 40,467,295 | +8 | 43,631,295 |
Riverside County | 1,545,387 | +42 | 2,189,641 | +14 | 2,493,116 | +14 | 2,843,493 |
Total Working Age Population:
Total Households:
Total Working Age Population:
Total Households:
Total Working Age Population:
Total Households: