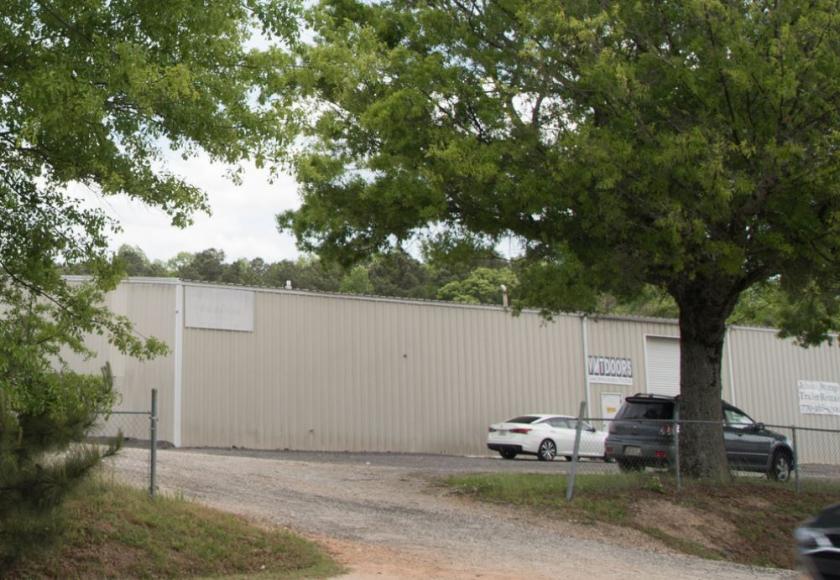
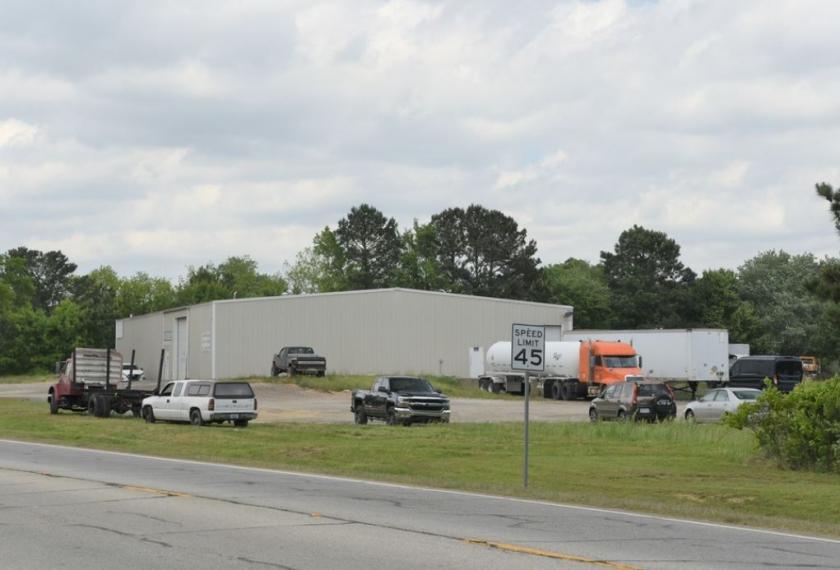
1-Mile | 3-Miles | 5-Miles | ||
---|---|---|---|---|
Total Population | 1,398 | 13,186 | 34,658 | |
Population Median Age | 38 | 38 | 38 | |
Population by Age | 0-9 Yrs | 163 (11%) | 1635 (12%) | 4434 (12%) |
10-19 Yrs | 224 (16%) | 2041 (15%) | 5190 (14%) | |
20-29 Yrs | 169 (12%) | 1584 (12%) | 3838 (11%) | |
30-39 Yrs | 190 (13%) | 1657 (12%) | 4244 (12%) | |
40-49 Yrs | 156 (11%) | 1656 (12%) | 4801 (13%) | |
50-59 Yrs | 257 (18%) | 2080 (15%) | 5010 (14%) | |
60-69 Yrs | 141 (10%) | 1336 (10%) | 3606 (10%) | |
70+ Yrs | 99 (7%) | 1196 (9%) | 3535 (10%) | |
Median HH Income | $71,390 | $70,889 | $70,584 | |
Total Household Income | < 24K | 68 (14%) | 573 (12%) | 1491 (12%) |
25-49K | 84 (17%) | 867 (19%) | 2369 (20%) | |
50-74K | 95 (20%) | 900 (20%) | 2343 (20%) | |
75-99K | 80 (17%) | 770 (17%) | 1889 (16%) | |
100-199K | 125 (26%) | 1072 (24%) | 2982 (25%) | |
200K+ | 18 (3%) | 230 (5%) | 584 (5%) | |
Highest Education Level | No Diploma | 95 | 886 | 2300 |
Diploma or GED | 379 | 3228 | 8128 | |
Some College | 209 | 1822 | 5017 | |
Assoc. Degree | 104 | 991 | 2292 | |
Bachelors Degree | 116 | 1324 | 3731 | |
Higher Degree | 47 | 604 | 1862 | |
Total Housing Units | 490 | 4,567 | 12,231 | |
--Owner-Occupied | 399 | 3,745 | 9,611 | |
--Renter-Occupied | 70 | 667 | 2,047 | |
Owner-Occupied Values | < 100K | 58 | 438 | 973 |
100-199K | 211 | 1713 | 3899 | |
200-299K | 78 | 945 | 2720 | |
300-399K | 32 | 448 | 1326 | |
400-499K | 10 | 111 | 381 | |
500K+ | 10 | 90 | 313 | |
Total Working Age Population | 1,081 | 10,243 | 26,951 | |
In Work Force | 704 | 6,377 | 16,530 | |
Not In Work Force | 378 | 3,866 | 10,421 | |
Workforce Employed | 680 | 6,112 | 15,798 | |
Workforce Unemployed | 22 | 243 | 710 | |
Civlian Workforce | 702 | 6,355 | 16,508 | |
Military Workforce | 2 | 22 | 22 | |
Total Households | 469 | 4,411 | 11,658 | |
Family Households | 358 | 3,350 | 9,176 | |
Non-Family Households | 111 | 1,061 | 2,483 | |
Married Couple | 287 | 2,658 | 7,307 | |
Other Family | 71 | 692 | 1,868 | |
Married w/Child | 123 | 1,158 | 3,138 | |
Single Male w/Child | 11 | 96 | 271 | |
Single Female w/Child | 29 | 317 | 733 |
Population Change Last Two Decades - Plus Projection
2000 | % | 2010 | % | 2020 | % | 2030 | |
---|---|---|---|---|---|---|---|
Georgia | 8,186,453 | +18 | 9,687,653 | +12 | 10,833,472 | +13 | 12,292,423 |
Gwinnett County | 588,448 | +37 | 805,321 | +21 | 971,145 | +21 | 1,175,358 |
Newton County | 62,001 | +61 | 99,958 | +12 | 112,354 | +15 | 128,770 |
Rockdale County | 70,111 | +22 | 85,215 | +11 | 94,960 | +18 | 112,165 |
Walton County | 60,687 | +38 | 83,768 | +14 | 95,814 | +14 | 109,179 |
Total Working Age Population:
Total Households:
Total Working Age Population:
Total Households:
Total Working Age Population:
Total Households: