Industrial Properties
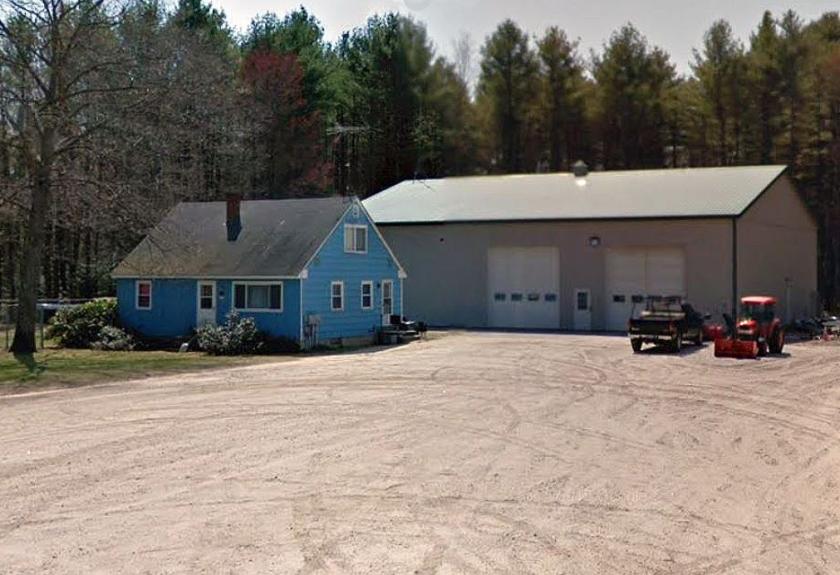
103 Old Brunswick Road Durham, ME 04222
103 Old Brunswick Road Durham, ME 04222
Details & Description
Property Highlights
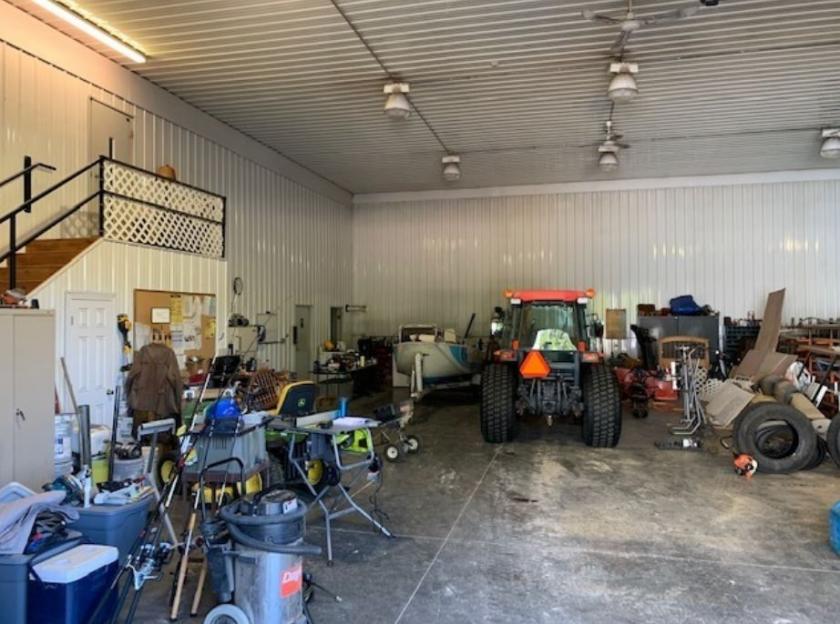
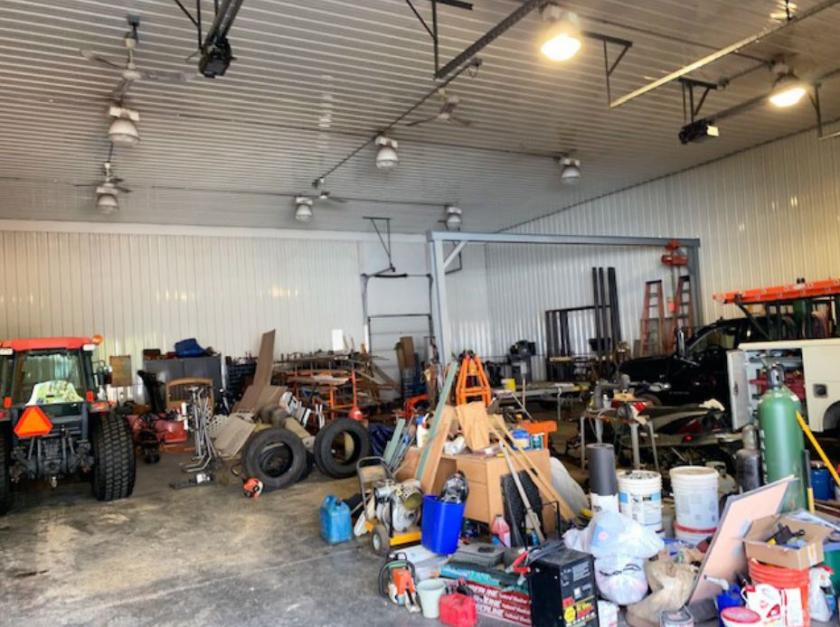
- • LARGE1 SMALL DRIVE-IN BAYS, OFFICE BATH
- • CONVENIENT TO FREEPORT BRUNSWICK
- • INCLUDES 3 BR 1 BATH INCOME PRODUCING PROPERTY
- • LARGE QUALITY-BUILT GARAGE WITH MEETING AREA
Additional Photos

Listing Agents

Kirk Butterfield
O: 207-879-9800
M: 207-205-4007
kbutterfield@kw.com
O: 207-879-9800
M: 207-205-4007
kbutterfield@kw.com
While we strive to provide the most accurate information, all listing information, and demographic data, is provided by third-parties. As such, MyEListing will not be responsible for the accuracy of the information. It is strongly recommended that you verify all information with the listing agent, and any relevant agencies, prior to making any decisions.


