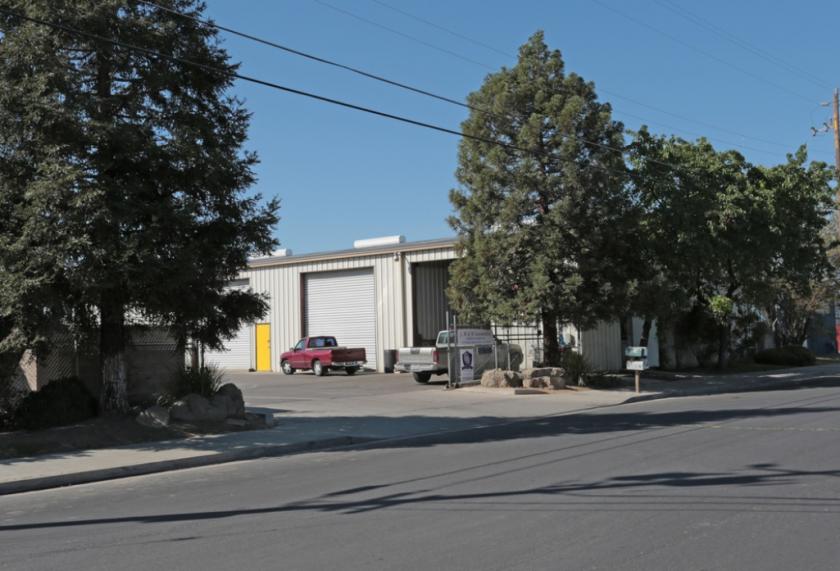
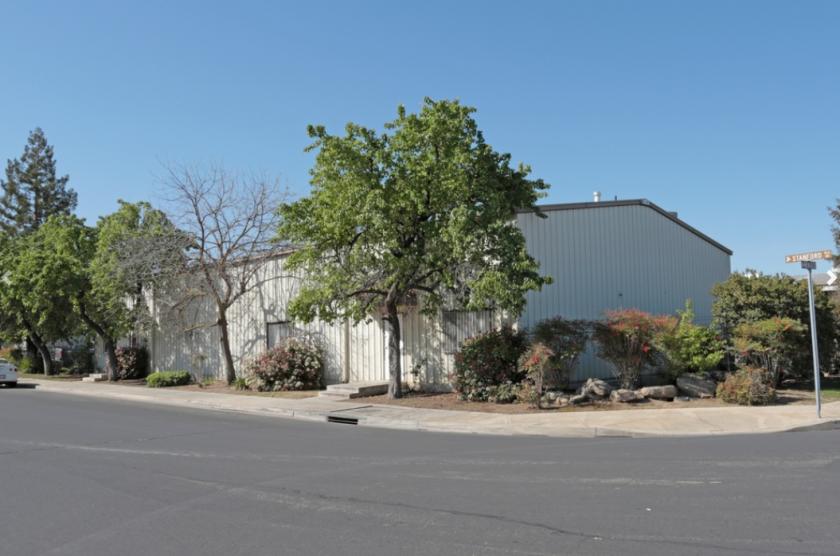
±14,850 SF commercial service multi-tenant complex on 1.07 Acres (46,609 SF) in Clovis, CA. Total of (3) freestanding buildings (w/ room for a 4th) offering (6) economical separately metered spaces leased to long-term tenants on AIR Industrial Gross leases. Value-add opportunity with actual rents of $90,840/year collected plus upside potential. The realistic 6-12 month stabilized gross annual income is $117,312. Unique investment offering easy-to-rent warehouse spaces within an under-built market offering a strong need for these type of spaces. Once stabilized, the deal offers TEEN cash-on-cash returns when leveraged. Great visibility, convenient parking & easy access to CA-168 on/off ramps. Many front parking spaces available and excellent existing corner signage.Multiple configurations ranging from 1,250 SF up to 3,700 SF with contiguous potential of 4,950 SF per building. Setup to have a office/showroom, shop, and fenced yard. Equipped w/ ample power, roll up doors, restrooms, sky lights, air vents, evap coolers, heaters, security, separate meters, and have the ability to be combined.(2) tenants are at market rents w/ leases for another year. The value-add opportunity consists of increasing rent and extending lease length over the next 6-12 months on (4) MTM units of 10,525 SF. Proposed market rates are $0.65/SF for the larger units and $0.70/SF for the smaller units on a modified gross basis providing an upside of 29% in overall cash-flow. Further opportunity consist of passing along the water/trash cost as per market standards resulting in an additional $4,800 in annual expense reduction.