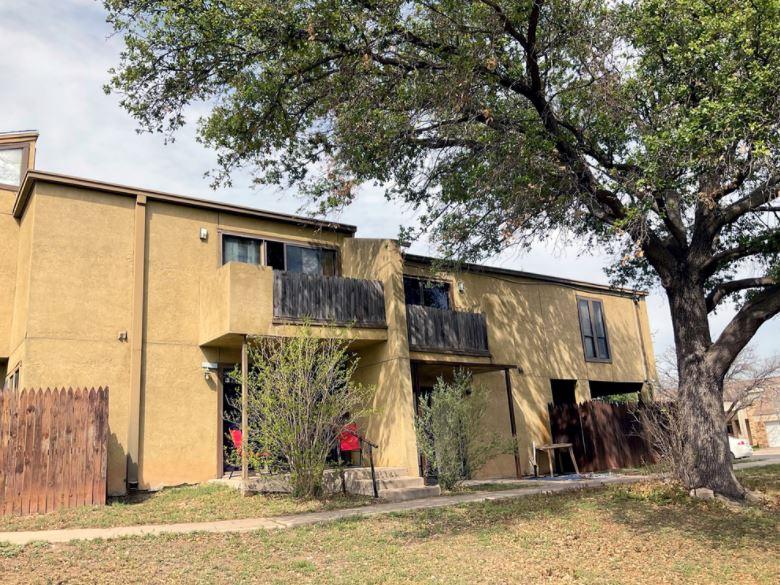
Multifamily Housing
1506 Greenwood Street San Angelo, TX 76901
1506 Greenwood Street San Angelo, TX 76901
Details & Description
Property Highlights
• The watersewertrash bill is currently being paid by the owner and not allocated to the tenant.
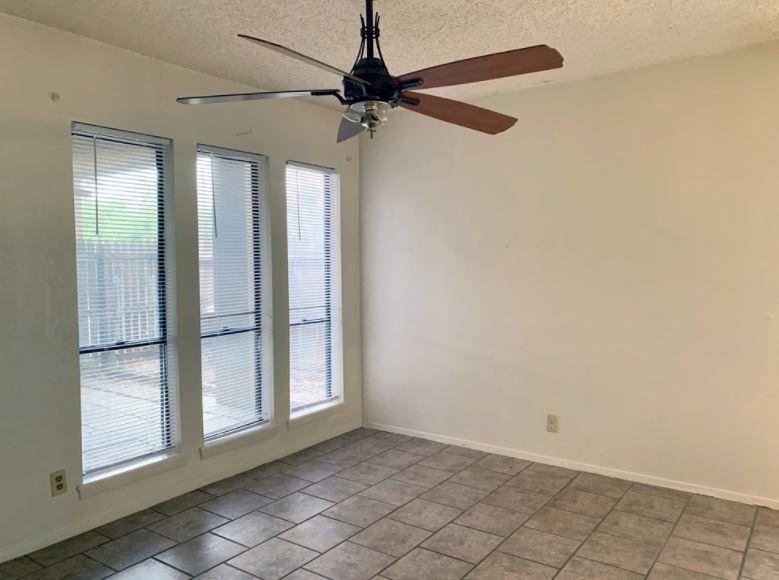
• The unit sizes are on average 65 sf larger than the other properties used as rent comps.
Additional Photos


Listing Agents

Greg Brownd
O: 806-777-4459
M: 806-777-4459
gregbrownd@kwcommercial.com
O: 806-777-4459
M: 806-777-4459
gregbrownd@kwcommercial.com
While we strive to provide the most accurate information, all listing information, and demographic data, is provided by third-parties. As such, MyEListing will not be responsible for the accuracy of the information. It is strongly recommended that you verify all information with the listing agent, and any relevant agencies, prior to making any decisions.


