Retail Space
2532 Willakenzie Road Eugene, OR 97401
2532 Willakenzie Road Eugene, OR 97401
Details & Description
Property Highlights
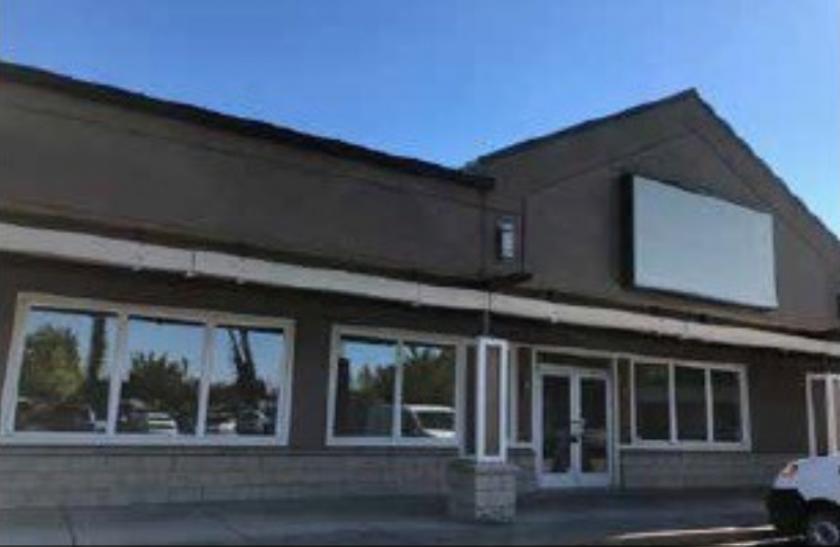
• Large open retail area with small office and two ADA restrooms
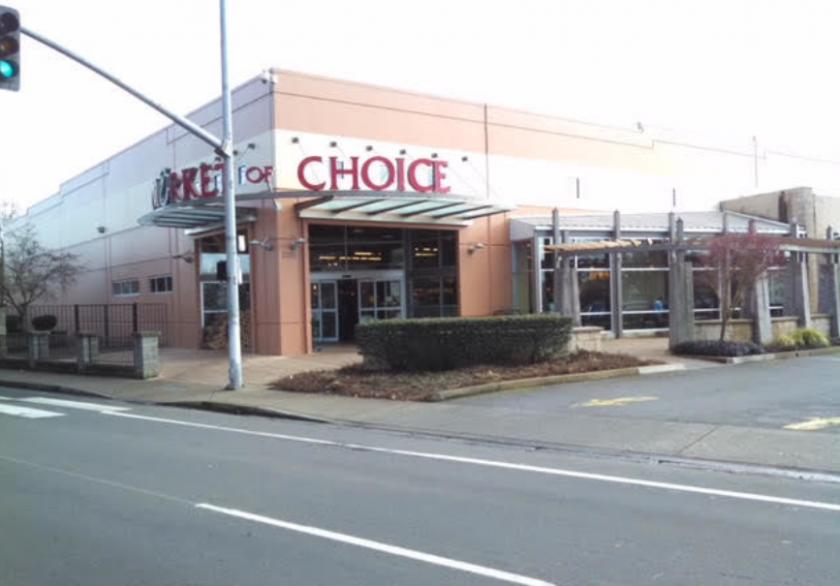
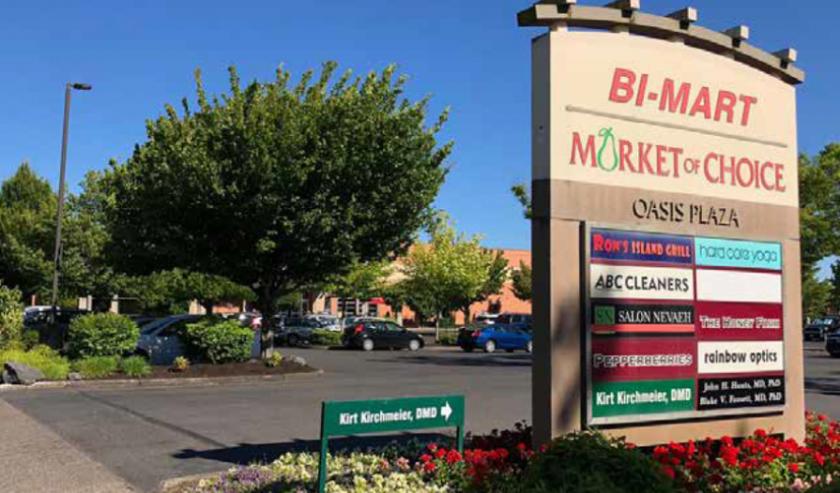
• Busy pedestrian and traffic center with strong demographics
Listing Agents

Maria Duncan
O: 503-869-5150
mduncan@kwcommercial.com
O: 503-869-5150
mduncan@kwcommercial.com
While we strive to provide the most accurate information, all listing information, and demographic data, is provided by third-parties. As such, MyEListing will not be responsible for the accuracy of the information. It is strongly recommended that you verify all information with the listing agent, and any relevant agencies, prior to making any decisions.