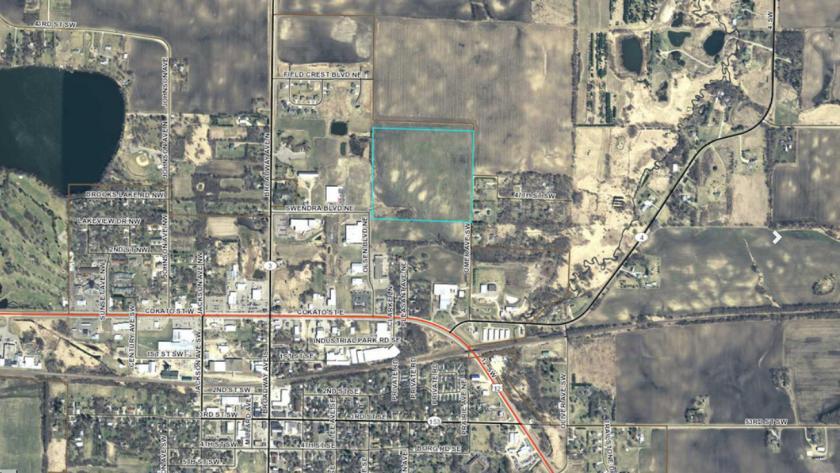
1-Mile | 3-Miles | 5-Miles | ||
---|---|---|---|---|
Total Population | 1,835 | 3,811 | 5,541 | |
Population Median Age | 37 | 38 | 38 | |
Population by Age | 0-9 Yrs | 271 (14%) | 560 (14%) | 785 (14%) |
10-19 Yrs | 323 (17%) | 633 (16%) | 936 (16%) | |
20-29 Yrs | 221 (12%) | 423 (11%) | 570 (10%) | |
30-39 Yrs | 240 (13%) | 442 (11%) | 602 (10%) | |
40-49 Yrs | 193 (10%) | 427 (11%) | 650 (11%) | |
50-59 Yrs | 222 (12%) | 512 (13%) | 817 (14%) | |
60-69 Yrs | 145 (7%) | 362 (9%) | 577 (10%) | |
70+ Yrs | 221 (12%) | 453 (11%) | 604 (10%) | |
Median HH Income | $57,107 | $56,939 | $64,008 | |
Total Household Income | < 24K | 146 (22%) | 278 (20%) | 322 (16%) |
25-49K | 136 (21%) | 310 (22%) | 403 (20%) | |
50-74K | 134 (20%) | 296 (21%) | 422 (21%) | |
75-99K | 112 (17%) | 226 (16%) | 328 (16%) | |
100-199K | 99 (15%) | 225 (16%) | 412 (21%) | |
200K+ | 13 (2%) | 31 (2%) | 67 (3%) | |
Highest Education Level | No Diploma | 112 | 225 | 287 |
Diploma or GED | 455 | 881 | 1279 | |
Some College | 292 | 610 | 836 | |
Assoc. Degree | 110 | 274 | 446 | |
Bachelors Degree | 120 | 294 | 477 | |
Higher Degree | 67 | 128 | 191 | |
Total Housing Units | 668 | 1,445 | 2,127 | |
--Owner-Occupied | 434 | 890 | 1,409 | |
--Renter-Occupied | 207 | 477 | 545 | |
Owner-Occupied Values | < 100K | 98 | 143 | 171 |
100-199K | 231 | 422 | 558 | |
200-299K | 89 | 216 | 386 | |
300-399K | 13 | 65 | 169 | |
400-499K | 2 | 25 | 64 | |
500K+ | 1 | 19 | 62 | |
Total Working Age Population | 1,368 | 2,867 | 4,200 | |
In Work Force | 920 | 1,908 | 2,839 | |
Not In Work Force | 448 | 959 | 1,361 | |
Workforce Employed | 885 | 1,854 | 2,773 | |
Workforce Unemployed | 34 | 54 | 66 | |
Civlian Workforce | 920 | 1,908 | 2,839 | |
Military Workforce | 0 | 0 | 0 | |
Total Households | 641 | 1,366 | 1,954 | |
Family Households | 441 | 926 | 1,367 | |
Non-Family Households | 200 | 440 | 586 | |
Married Couple | 283 | 654 | 1,056 | |
Other Family | 159 | 272 | 311 | |
Married w/Child | 115 | 272 | 423 | |
Single Male w/Child | 41 | 66 | 79 | |
Single Female w/Child | 40 | 82 | 88 |
Population Change Last Two Decades - Plus Projection
2000 | % | 2010 | % | 2020 | % | 2030 | |
---|---|---|---|---|---|---|---|
Minnesota | 4,919,479 | +8 | 5,303,925 | +7 | 5,687,161 | +5 | 5,974,304 |
Meeker County | 22,644 | +3 | 23,300 | -1 | 23,043 | -2 | 22,642 |
Wright County | 89,986 | +39 | 124,700 | +10 | 136,890 | +6 | 145,773 |
Total Working Age Population:
Total Households:
Total Working Age Population:
Total Households:
Total Working Age Population:
Total Households: