Leasing Opportunity * The Best Bar/Restaurant Site in Downtown St Pete?
Arguably the hottest block in Town - The Jannus Block. First Friday the street is blocked off for the best block party in town. Many tenants on this block make their rent on First Friday's alone.
Bar / Restaurant / Venue For Lease on Central Avenue in Downtown St Petersburg
Bring your imagination to invent a new concept or extend the reach of your existing concept to this prime site. It is hard to overstate the potential here. If you know Downtown St Pete, you know this site. You have walked by this site and so has every other resident or visitor in St Pete almost assuredly – and most likely hundreds of times!
This Offering is for the lease of 5700 SF +/- of indoor space together with 2000 SF +/- Courtyard and a Sidewalk Café Seating area of 1500 SF+
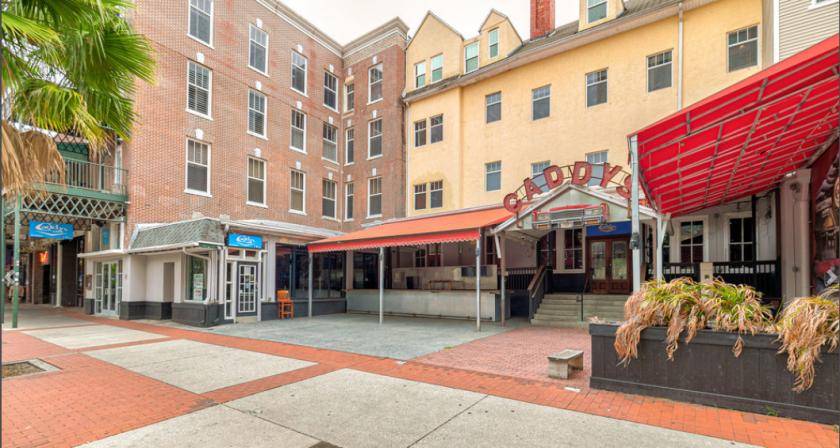
Located on the Famed Central Avenue on the First Friday Corridor and the Jannus Block.
One of the Most Popular Restaurant & Bar sites on Central Avenue in Downtown St Petersburg is now available.
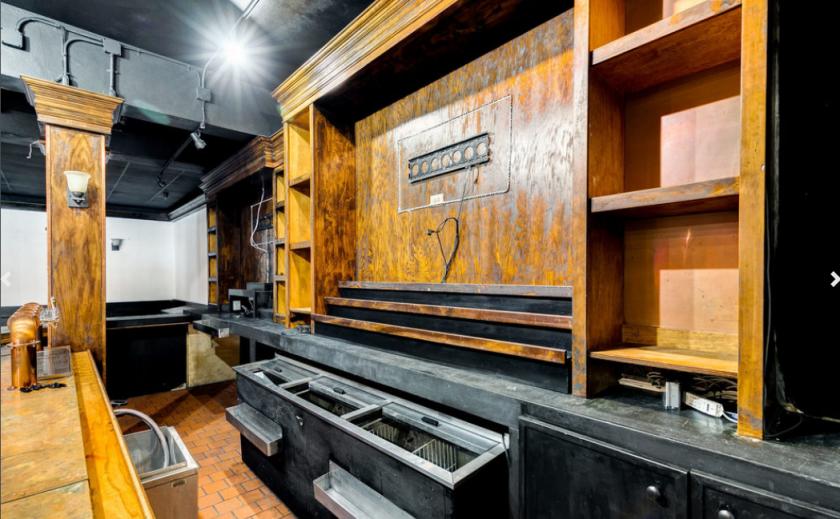
Our Offering is for a second generation Bar, Lounge, Restaurant, Dance Club, Venue on Central Avenue. The Floor plan consists of built out Kitchen (hood/grease trap in place) * 3 Existing Bars * Huge outdoor off-sidewalk partially covered courtyard * Giant double wide sidewalk cafe Live Music / DJ Stage.
The location is well known and is considered a destination place in a destination downtown in a destination city in a destination state.
The Location benefits highly from the monthly First Friday and like most downtown businesses - so much that rent is easily paid from this one evening.
The Walkability Score is a full 100% > Weekend Pedestrian Counts are as high as 4,200 person count per hour.
St Petersburg now has serious critical mass when it comes to downtown residents - within the last 5 years, thousands upon thousands now live in or near downtown. Pedestrian Traffic is at an all-time high - rivaling other great destinations such as Duvall Street, Bourbon Street, and Lincoln Road.
This site should easily qualify for an incidental liquor license (SRX/SFS) allowing a tenant to serve liquor without having to purchase a State of Florida Pinellas County 4COP Liquor License. The 4COP License savings is $350,000 +/- on the open Market.
Location Description: Simply the Best location on Central Avenue. The Site sits on one of the best blocks in downtown St Petersburg. Tenants are reporting sales in excess of $1,000 per square foot in this corridor.
The Jannus Block Address is in the midst of all the action - near all the other most happening downtown districts like Beach Drive / 600 Block / and the Downtown Core.
The location is easily accessible from all parts of the city being only 3 minutes to the Interstate * being between First Avenue South and First Avenue South which are the two One-Ways leading in & out of Downtown * being one minute from 3rd/4th Streets which are the major north-south corridors of St Petersburg that leads to many of the great neighborhoods and to I-175 and I-375.
***Please note that this site requires a $65,000 key fee. This will get the customer access to full architectural plans in CAD for tweaking to their own concept as well as an existing in place permit. While a typical permit may take 2-3 mos for approval in St Pete, Historical buildings often take 8-12 mos. This is an incredibly significant time savings on start time and rents.***