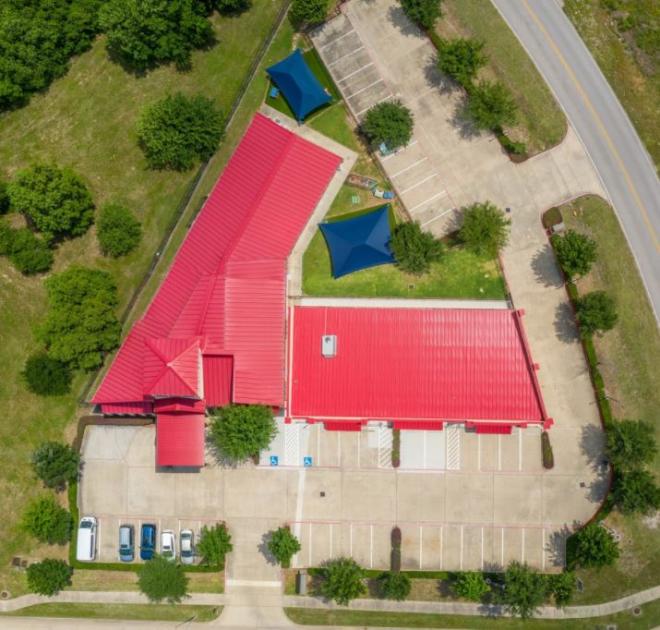
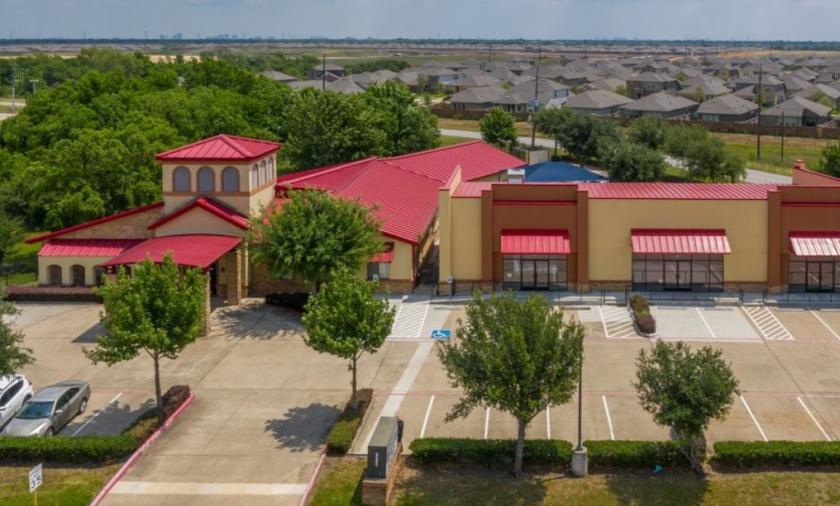
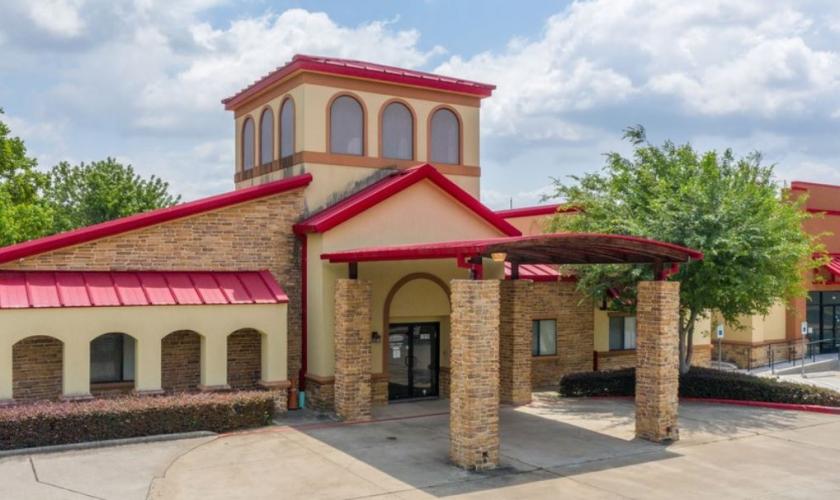
1-Mile | 3-Miles | 5-Miles | ||
---|---|---|---|---|
Total Population | 10,220 | 86,765 | 235,765 | |
Population Median Age | 32 | 33 | 35 | |
Population by Age | 0-9 Yrs | 1944 (19%) | 13934 (16%) | 35611 (15%) |
10-19 Yrs | 1456 (14%) | 14065 (16%) | 36852 (15%) | |
20-29 Yrs | 1311 (12%) | 11224 (12%) | 29272 (12%) | |
30-39 Yrs | 1785 (17%) | 13490 (15%) | 33340 (14%) | |
40-49 Yrs | 1702 (16%) | 13932 (16%) | 36625 (15%) | |
50-59 Yrs | 1050 (10%) | 10471 (12%) | 30400 (12%) | |
60-69 Yrs | 613 (5%) | 5993 (6%) | 21021 (8%) | |
70+ Yrs | 359 (3%) | 3656 (4%) | 12643 (5%) | |
Median HH Income | $103,446 | $93,273 | $90,051 | |
Total Household Income | < 24K | 144 (4%) | 2118 (8%) | 7706 (10%) |
25-49K | 239 (8%) | 3305 (13%) | 10572 (14%) | |
50-74K | 526 (18%) | 4279 (17%) | 11498 (16%) | |
75-99K | 468 (16%) | 3780 (15%) | 9661 (13%) | |
100-199K | 1179 (40%) | 8539 (34%) | 22230 (31%) | |
200K+ | 332 (11%) | 2910 (11%) | 9518 (13%) | |
Highest Education Level | No Diploma | 362 | 5062 | 14220 |
Diploma or GED | 1026 | 9331 | 27833 | |
Some College | 1417 | 11977 | 31794 | |
Assoc. Degree | 437 | 3982 | 10376 | |
Bachelors Degree | 1900 | 13988 | 40756 | |
Higher Degree | 1135 | 8619 | 23757 | |
Total Housing Units | 2,980 | 26,091 | 75,431 | |
--Owner-Occupied | 2,418 | 19,379 | 52,240 | |
--Renter-Occupied | 470 | 5,552 | 18,945 | |
Owner-Occupied Values | < 100K | 17 | 828 | 2330 |
100-199K | 630 | 6159 | 16540 | |
200-299K | 1023 | 6751 | 16232 | |
300-399K | 537 | 3641 | 9436 | |
400-499K | 144 | 1271 | 3861 | |
500K+ | 67 | 728 | 3839 | |
Total Working Age Population | 7,324 | 64,002 | 176,476 | |
In Work Force | 5,282 | 44,566 | 119,862 | |
Not In Work Force | 2,042 | 19,436 | 56,614 | |
Workforce Employed | 5,007 | 42,313 | 113,779 | |
Workforce Unemployed | 251 | 2,133 | 5,893 | |
Civlian Workforce | 5,258 | 44,446 | 119,672 | |
Military Workforce | 24 | 120 | 190 | |
Total Households | 2,888 | 24,931 | 71,185 | |
Family Households | 2,585 | 21,783 | 59,734 | |
Non-Family Households | 302 | 3,148 | 11,451 | |
Married Couple | 2,170 | 17,234 | 47,076 | |
Other Family | 415 | 4,550 | 12,658 | |
Married w/Child | 1,331 | 9,916 | 24,966 | |
Single Male w/Child | 86 | 532 | 1,589 | |
Single Female w/Child | 129 | 1,805 | 5,207 |
Population Change Last Two Decades - Plus Projection
2000 | % | 2010 | % | 2020 | % | 2030 | |
---|---|---|---|---|---|---|---|
Texas | 20,851,820 | +21 | 25,145,561 | +18 | 29,677,668 | +18 | 34,894,452 |
Fort Bend County | 354,452 | +65 | 585,375 | +44 | 840,383 | +43 | 1,203,029 |
Harris County | 3,400,578 | +20 | 4,092,459 | +22 | 4,978,845 | +19 | 5,924,750 |
Total Working Age Population:
Total Households:
Total Working Age Population:
Total Households:
Total Working Age Population:
Total Households: