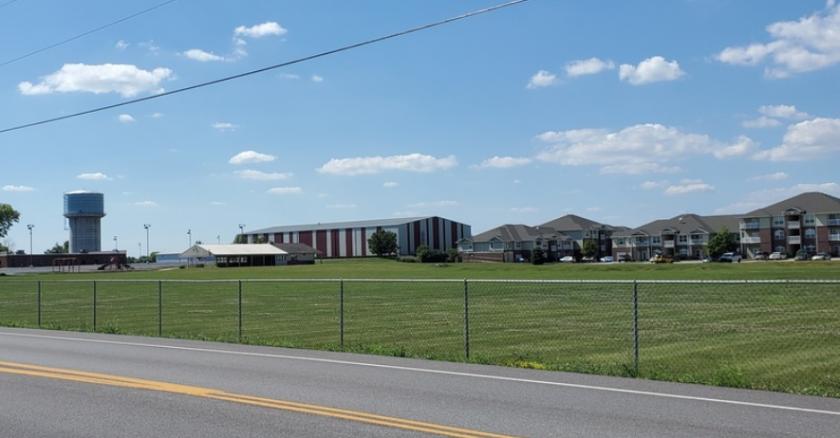
Commercial Land
2807 South State Road 135 Greenwood, IN 46143
2807 South State Road 135 Greenwood, IN 46143
Details & Description
Property Highlights
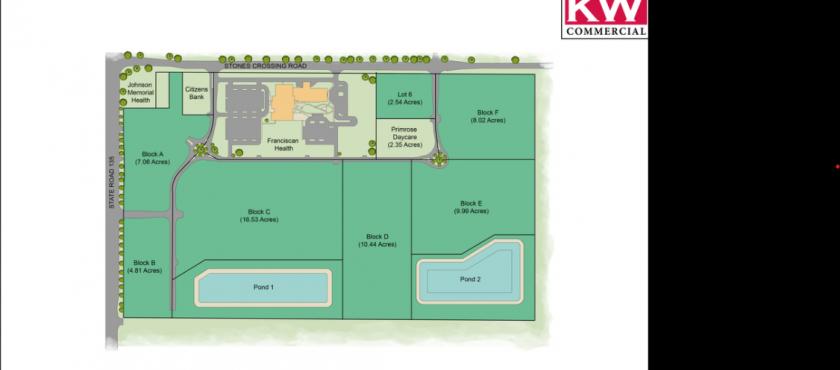
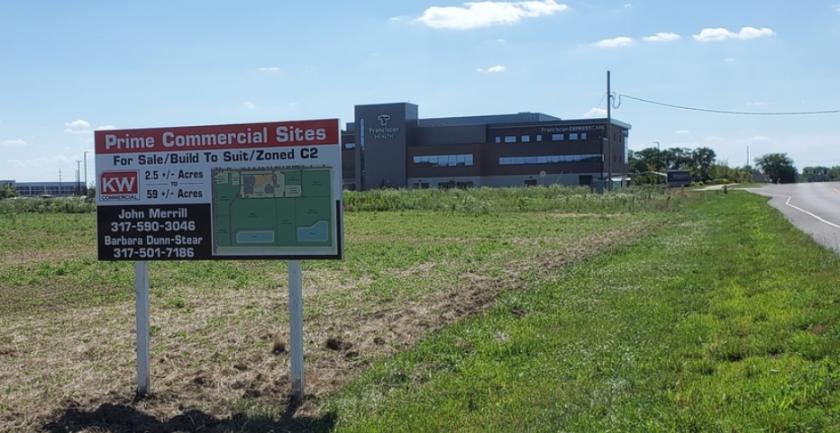
- • C 2 Zoning
- • Potential Ground Lease
- • 2-60 Acres Available
Listing Agents

Barbara DunnStear
O: 317-501-7186
M: 317-882-5900
bstear@kw.com
O: 317-501-7186
M: 317-882-5900
bstear@kw.com
While we strive to provide the most accurate information, all listing information, and demographic data, is provided by third-parties. As such, MyEListing will not be responsible for the accuracy of the information. It is strongly recommended that you verify all information with the listing agent, and any relevant agencies, prior to making any decisions.