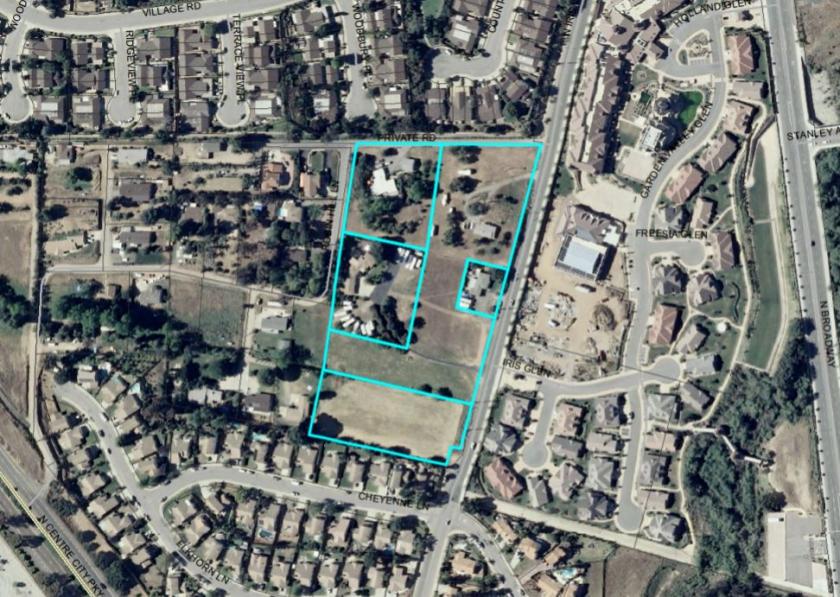
Commercial Land
2039 North Iris Lane Escondido, CA 92026
2039 North Iris Lane Escondido, CA 92026
Details & Description
Property Highlights
- • Close proximity to 1-15 and SR-78
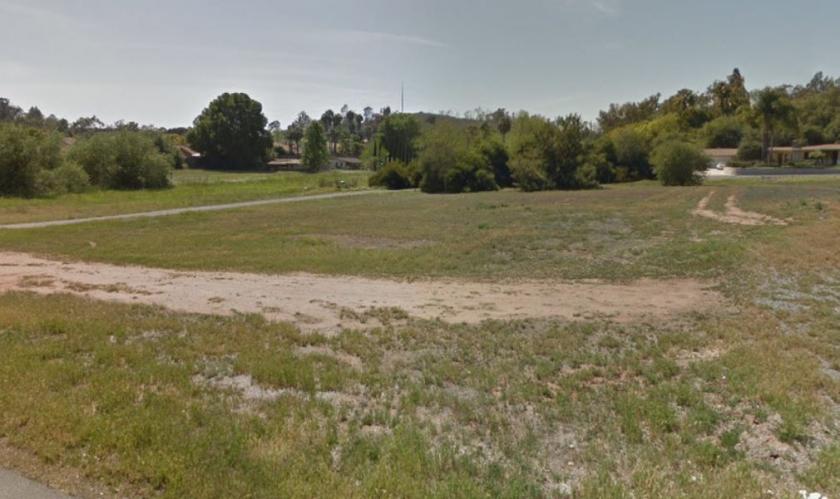
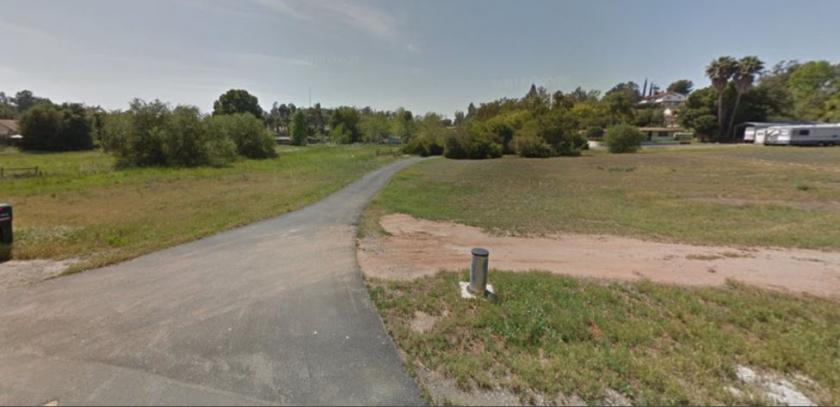
- • Flat to rolling topography
- • Rincon del Diablo Municipal Water District
Additional Photos

Listing Agents

Elizabeth Brignon
KW Commercial
O: 619-540-4208
ebrignon@kwcommercial.com
KW Commercial
O: 619-540-4208
ebrignon@kwcommercial.com
While we strive to provide the most accurate information, all listing information, and demographic data, is provided by third-parties. As such, MyEListing will not be responsible for the accuracy of the information. It is strongly recommended that you verify all information with the listing agent, and any relevant agencies, prior to making any decisions.


