Specialty Real Estate
330 Crans Mill Road Pine Bush, NY 12566
330 Crans Mill Road Pine Bush, NY 12566
Details & Description
Property Highlights
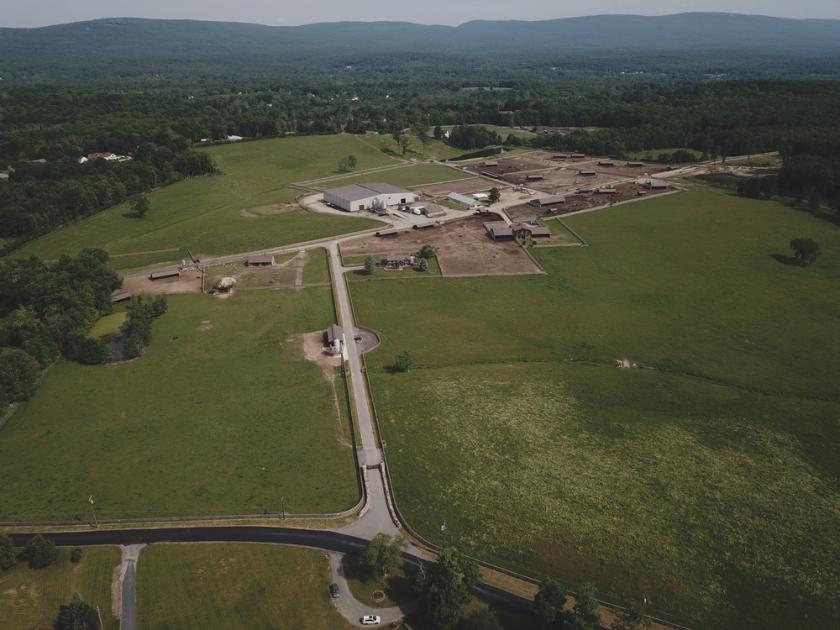
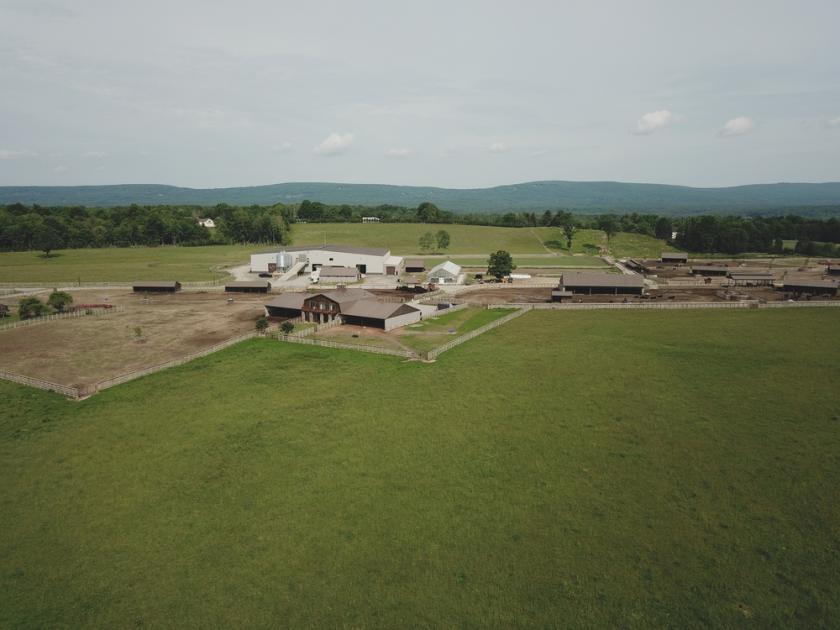
• Farm has 600 head of cattle, 4000 chickens, butcher-packing shop, greenhouse, horse barns, manager house, warehouse bui
• 635 Acres all gated and fenced with 34 miles of fencing
Listing Agents

Joseph Distelburger
KW Commercial
O: 845-344-7170
M: 845-344-7170
jdistelburger@gmail.com
KW Commercial
O: 845-344-7170
M: 845-344-7170
jdistelburger@gmail.com
While we strive to provide the most accurate information, all listing information, and demographic data, is provided by third-parties. As such, MyEListing will not be responsible for the accuracy of the information. It is strongly recommended that you verify all information with the listing agent, and any relevant agencies, prior to making any decisions.