Office Space
1701 Delco Park Drive Kettering, OH 45420
1701 Delco Park Drive Kettering, OH 45420

Details & Description
Property Highlights
- • 65 car parking lot
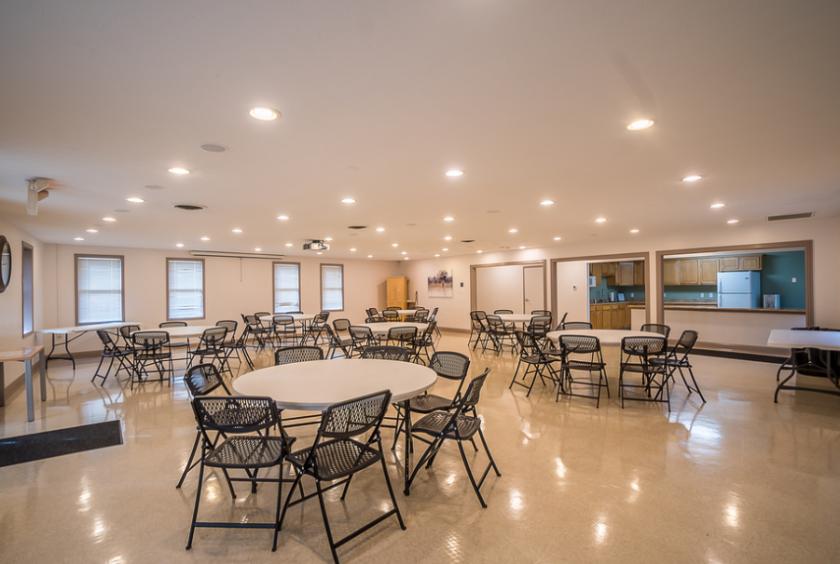
- • Income producing Meeting Place
- • New roof 2020
- • LED lighting inside and outside
Listing Agents

Greg Blatt
KW Commercial
O: 937-657-2876
M: 937-657-2876
greg.blatt@kw.com
KW Commercial
O: 937-657-2876
M: 937-657-2876
greg.blatt@kw.com

Bill Lee
KW COmmercial
O: 937-474-9395
bill.lee@kw.com
KW COmmercial
O: 937-474-9395
bill.lee@kw.com
While we strive to provide the most accurate information, all listing information, and demographic data, is provided by third-parties. As such, MyEListing will not be responsible for the accuracy of the information. It is strongly recommended that you verify all information with the listing agent, and any relevant agencies, prior to making any decisions.