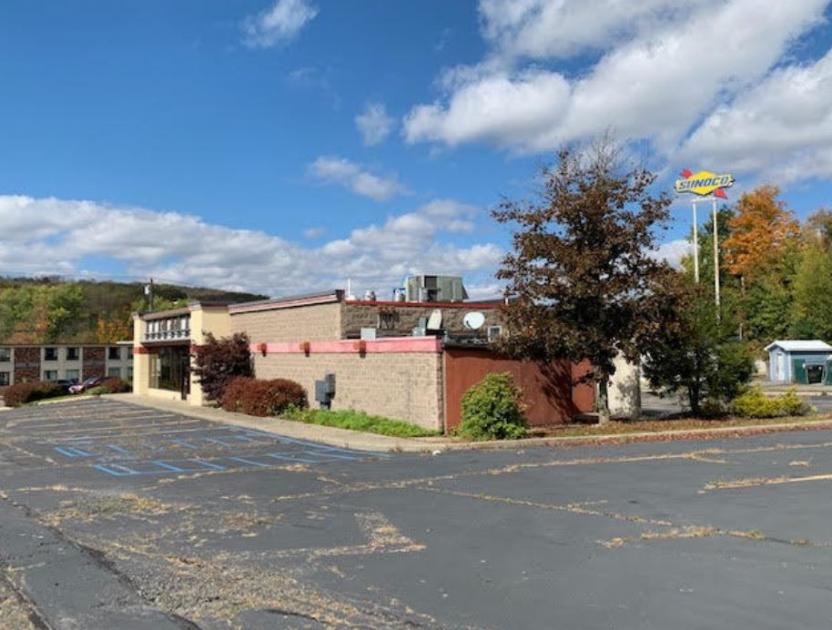
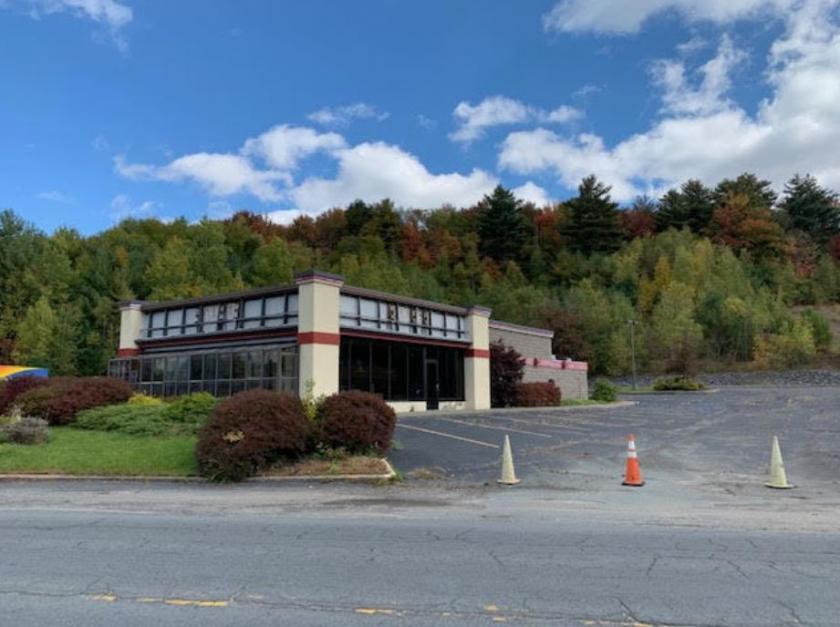
1-Mile | 3-Miles | 5-Miles | ||
---|---|---|---|---|
Total Population | 957 | 6,749 | 12,967 | |
Population Median Age | 42 | 39 | 39 | |
Population by Age | 0-9 Yrs | 69 (7%) | 768 (11%) | 1649 (12%) |
10-19 Yrs | 151 (15%) | 984 (14%) | 1945 (14%) | |
20-29 Yrs | 123 (12%) | 851 (12%) | 1634 (12%) | |
30-39 Yrs | 96 (10%) | 823 (12%) | 1499 (11%) | |
40-49 Yrs | 85 (8%) | 734 (10%) | 1489 (11%) | |
50-59 Yrs | 164 (17%) | 1049 (15%) | 1803 (13%) | |
60-69 Yrs | 146 (15%) | 890 (13%) | 1704 (13%) | |
70+ Yrs | 123 (12%) | 650 (9%) | 1244 (9%) | |
Median HH Income | $51,154 | $41,067 | $42,393 | |
Total Household Income | < 24K | 112 (33%) | 837 (34%) | 1381 (30%) |
25-49K | 49 (14%) | 543 (22%) | 1128 (24%) | |
50-74K | 92 (27%) | 457 (18%) | 756 (16%) | |
75-99K | 50 (14%) | 267 (10%) | 519 (11%) | |
100-199K | 17 (5%) | 268 (10%) | 580 (12%) | |
200K+ | 19 (5%) | 89 (3%) | 177 (3%) | |
Highest Education Level | No Diploma | 68 | 831 | 1558 |
Diploma or GED | 284 | 1776 | 3115 | |
Some College | 143 | 714 | 1450 | |
Assoc. Degree | 74 | 454 | 795 | |
Bachelors Degree | 35 | 343 | 808 | |
Higher Degree | 65 | 374 | 724 | |
Total Housing Units | 425 | 3,499 | 7,160 | |
--Owner-Occupied | 225 | 1,260 | 2,535 | |
--Renter-Occupied | 112 | 1,201 | 2,007 | |
Owner-Occupied Values | < 100K | 117 | 551 | 976 |
100-199K | 82 | 499 | 975 | |
200-299K | 12 | 107 | 340 | |
300-399K | 7 | 44 | 106 | |
400-499K | 1 | 20 | 60 | |
500K+ | 6 | 40 | 78 | |
Total Working Age Population | 847 | 5,466 | 10,297 | |
In Work Force | 416 | 3,011 | 5,756 | |
Not In Work Force | 430 | 2,455 | 4,541 | |
Workforce Employed | 383 | 2,783 | 5,256 | |
Workforce Unemployed | 34 | 228 | 500 | |
Civlian Workforce | 416 | 3,011 | 5,756 | |
Military Workforce | 0 | 0 | 0 | |
Total Households | 338 | 2,461 | 4,542 | |
Family Households | 166 | 1,470 | 2,895 | |
Non-Family Households | 172 | 991 | 1,647 | |
Married Couple | 99 | 846 | 1,734 | |
Other Family | 67 | 625 | 1,161 | |
Married w/Child | 39 | 369 | 701 | |
Single Male w/Child | 5 | 208 | 354 | |
Single Female w/Child | 45 | 207 | 413 |
Population Change Last Two Decades - Plus Projection
2000 | % | 2010 | % | 2020 | % | 2030 | |
---|---|---|---|---|---|---|---|
New York | 18,976,457 | +2 | 19,378,102 | +4 | 20,146,131 | +2 | 20,604,030 |
Delaware County | 48,055 | 0 | 47,980 | -7 | 44,419 | -5 | 42,076 |
Sullivan County | 73,966 | +5 | 77,547 | -3 | 74,968 | 0 | 74,720 |
Ulster County | 177,749 | +3 | 182,493 | -2 | 179,009 | -1 | 176,893 |
Total Working Age Population:
Total Households:
Total Working Age Population:
Total Households:
Total Working Age Population:
Total Households: