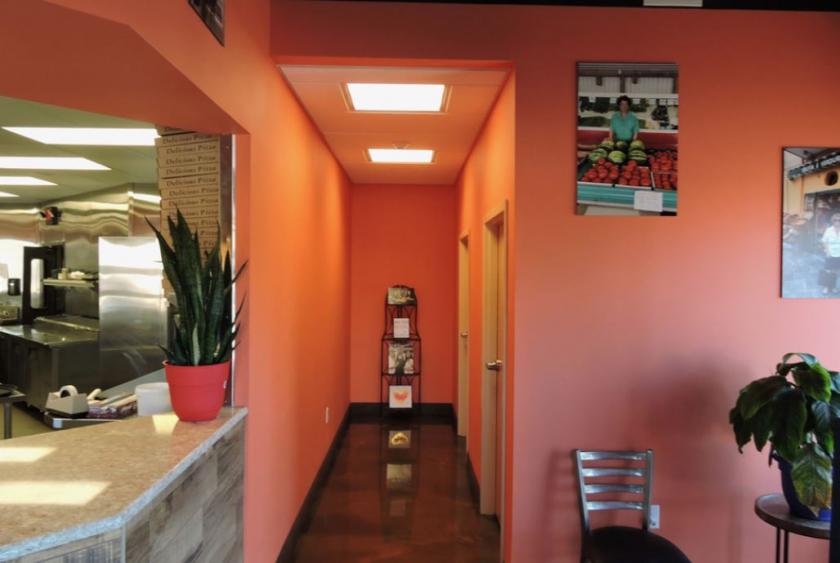
Retail Space
3 Harden Boulevard Camden, NY 13316
3 Harden Boulevard Camden, NY 13316
Details & Description
Property Highlights
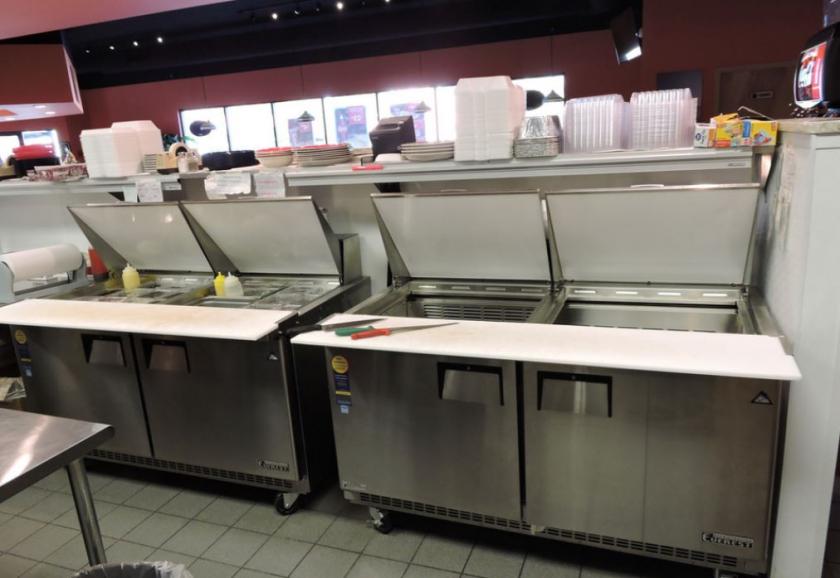
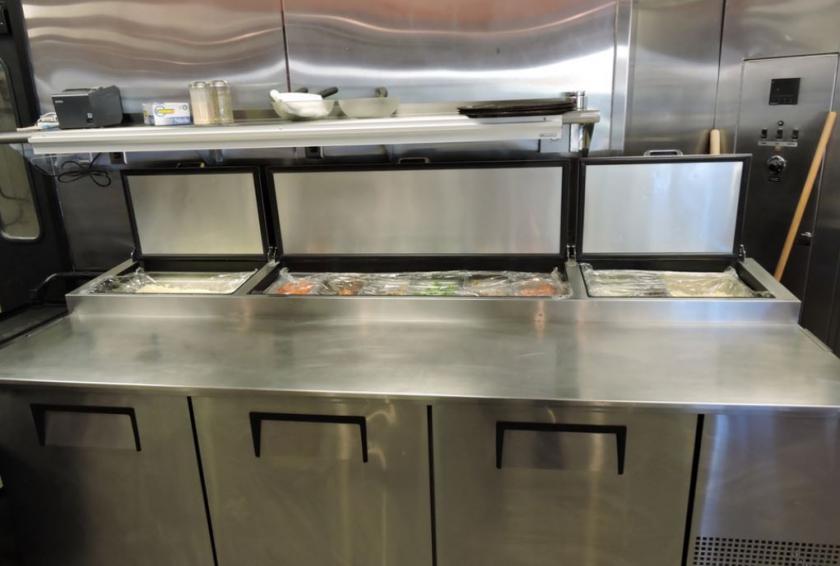
- • Two 60 Stainless Steel Everest Sandwich Units
- • 48 and 60 Total Stainless-Steel Prep Tables
- • Four Pitco Deep Fryers 65 pound
- • 60 Sunfire Ten Burner Stove with Double Ovens
- • One Six Foot Everest 3 Door Stainless Steel Cooler
- • One Imperial Brown 6 X 10 Walk In Cooler
Additional Photos

Listing Agents

Jeffrey Crannell
KW Commercial
O: 315-941-6259
jcrannell@kwcommercial.com
KW Commercial
O: 315-941-6259
jcrannell@kwcommercial.com
While we strive to provide the most accurate information, all listing information, and demographic data, is provided by third-parties. As such, MyEListing will not be responsible for the accuracy of the information. It is strongly recommended that you verify all information with the listing agent, and any relevant agencies, prior to making any decisions.


