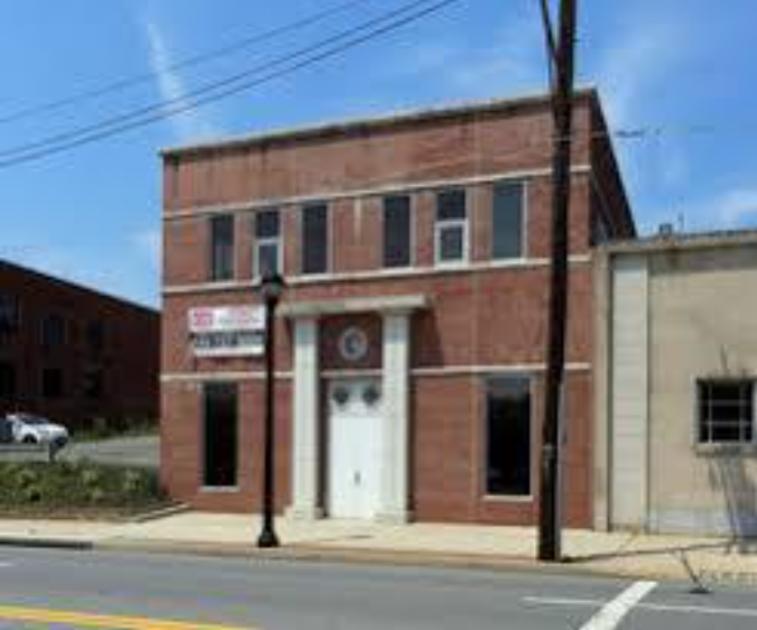
Office Space
5214 Baltimore Avenue Hyattsville, MD 20781
5214 Baltimore Avenue Hyattsville, MD 20781
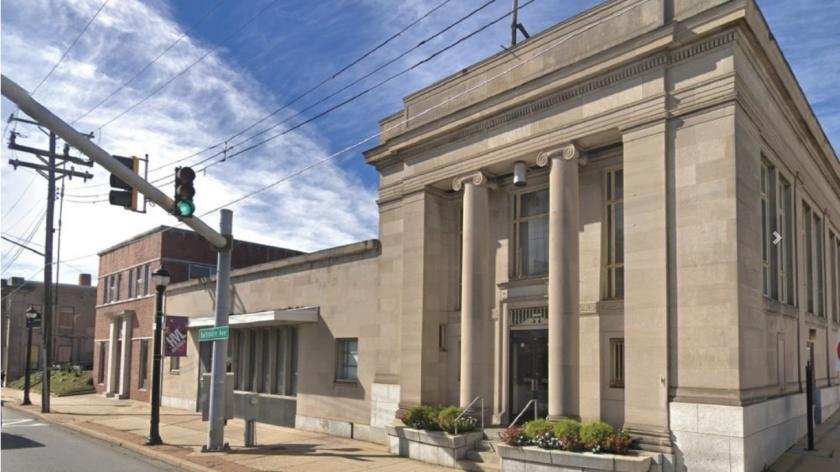
Details & Description
Property Highlights
- • 30,000 sq.ft available for Development
- • Heavy Traffic Count
- • History Bank building
- • Center of Hyattsville Gateway Arts District
- • Private parking with 45 spaces
- • WALK SCORE
Listing Agents

Anthony Bolling
O: 240-737-5054
M: 240-339-6979
anthony@anthonybollinggroup.com
O: 240-737-5054
M: 240-339-6979
anthony@anthonybollinggroup.com
While we strive to provide the most accurate information, all listing information, and demographic data, is provided by third-parties. As such, MyEListing will not be responsible for the accuracy of the information. It is strongly recommended that you verify all information with the listing agent, and any relevant agencies, prior to making any decisions.