Retail Space
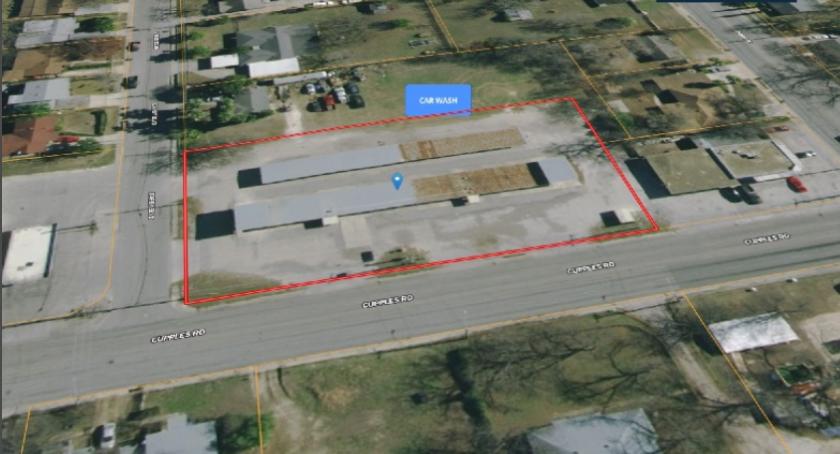
1018 Cupples Road San Antonio, TX 78237
1018 Cupples Road San Antonio, TX 78237
Details & Description
Property Highlights
- • Large Corner Lot
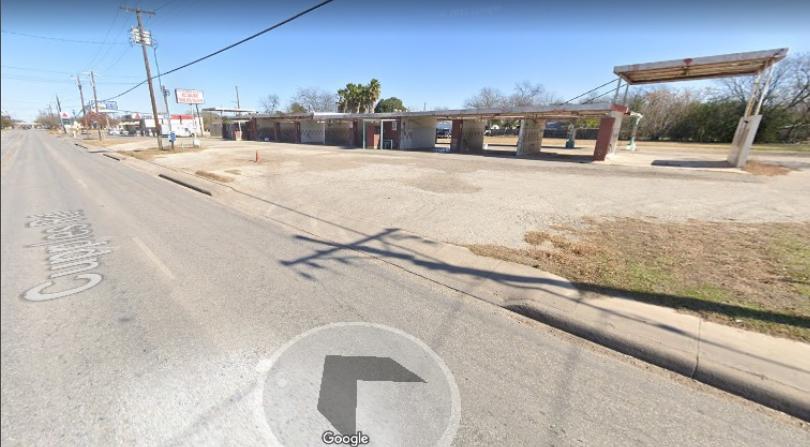
- • 2 Truck Rv Wash Bays
- • Opportunity to Repurpose Property
- • 11 Car Wash Bays
- • Multiple Vacuum Bays
Listing Agents

Rex Blackburn
O: 210-245-7373
M: 210-823-3721
info@bluecollarcre.com
O: 210-245-7373
M: 210-823-3721
info@bluecollarcre.com

Scott Forester
M: 830-708-1340
scott.forester@kw.com
M: 830-708-1340
scott.forester@kw.com
While we strive to provide the most accurate information, all listing information, and demographic data, is provided by third-parties. As such, MyEListing will not be responsible for the accuracy of the information. It is strongly recommended that you verify all information with the listing agent, and any relevant agencies, prior to making any decisions.