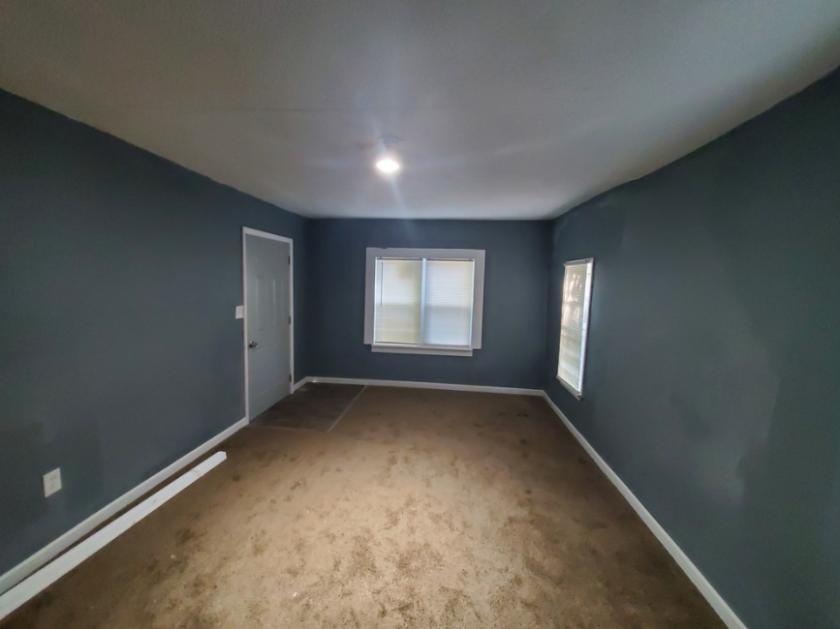
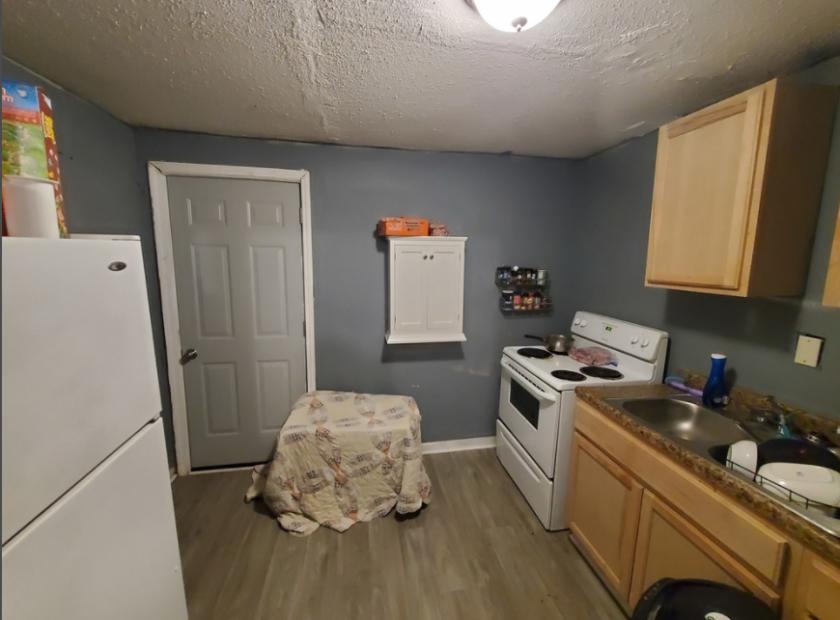
1-Mile | 3-Miles | 5-Miles | ||
---|---|---|---|---|
Total Population | 10,286 | 53,002 | 173,275 | |
Population Median Age | 36 | 36 | 35 | |
Population by Age | 0-9 Yrs | 1741 (16%) | 7957 (15%) | 26914 (15%) |
10-19 Yrs | 1177 (11%) | 6656 (12%) | 20864 (12%) | |
20-29 Yrs | 1425 (13%) | 7836 (14%) | 27271 (15%) | |
30-39 Yrs | 1810 (17%) | 8182 (15%) | 27928 (16%) | |
40-49 Yrs | 1034 (10%) | 5892 (11%) | 20382 (11%) | |
50-59 Yrs | 1143 (11%) | 6399 (12%) | 20542 (11%) | |
60-69 Yrs | 1245 (12%) | 6026 (11%) | 17527 (10%) | |
70+ Yrs | 709 (6%) | 4055 (7%) | 11847 (6%) | |
Median HH Income | $37,100 | $36,324 | $36,000 | |
Total Household Income | < 24K | 1483 (35%) | 7778 (36%) | 24118 (36%) |
25-49K | 1404 (33%) | 5896 (28%) | 18456 (27%) | |
50-74K | 650 (15%) | 3178 (15%) | 9615 (14%) | |
75-99K | 327 (7%) | 2090 (9%) | 5768 (8%) | |
100-199K | 279 (6%) | 1703 (8%) | 6562 (9%) | |
200K+ | 4 (0%) | 381 (1%) | 1587 (2%) | |
Highest Education Level | No Diploma | 1469 | 6647 | 18950 |
Diploma or GED | 2289 | 11340 | 36741 | |
Some College | 1393 | 6814 | 23269 | |
Assoc. Degree | 319 | 2426 | 7944 | |
Bachelors Degree | 996 | 5204 | 17055 | |
Higher Degree | 252 | 2506 | 9849 | |
Total Housing Units | 5,169 | 26,873 | 82,046 | |
--Owner-Occupied | 1,249 | 7,401 | 24,257 | |
--Renter-Occupied | 2,897 | 13,626 | 41,848 | |
Owner-Occupied Values | < 100K | 644 | 3299 | 9595 |
100-199K | 469 | 2521 | 7845 | |
200-299K | 100 | 1032 | 3399 | |
300-399K | 23 | 281 | 1830 | |
400-499K | 7 | 64 | 722 | |
500K+ | 7 | 205 | 866 | |
Total Working Age Population | 7,706 | 40,573 | 132,662 | |
In Work Force | 4,862 | 26,323 | 84,281 | |
Not In Work Force | 2,844 | 14,250 | 48,381 | |
Workforce Employed | 4,560 | 23,875 | 76,305 | |
Workforce Unemployed | 301 | 2,427 | 7,873 | |
Civlian Workforce | 4,861 | 26,303 | 84,177 | |
Military Workforce | 1 | 21 | 104 | |
Total Households | 4,146 | 21,027 | 66,106 | |
Family Households | 1,860 | 10,045 | 33,225 | |
Non-Family Households | 2,286 | 10,981 | 32,881 | |
Married Couple | 608 | 3,796 | 12,894 | |
Other Family | 1,253 | 6,250 | 20,331 | |
Married w/Child | 283 | 1,326 | 4,838 | |
Single Male w/Child | 104 | 328 | 1,453 | |
Single Female w/Child | 624 | 2,693 | 8,596 |
Population Change Last Two Decades - Plus Projection
2000 | % | 2010 | % | 2020 | % | 2030 | |
---|---|---|---|---|---|---|---|
Georgia | 8,186,453 | +18 | 9,687,653 | +12 | 10,833,472 | +13 | 12,292,423 |
Clayton County | 236,517 | +10 | 259,424 | +18 | 304,838 | +22 | 373,234 |
DeKalb County | 665,865 | +4 | 691,893 | +15 | 793,154 | +19 | 944,045 |
Fulton County | 816,006 | +13 | 920,581 | +19 | 1,099,181 | +18 | 1,300,861 |
Henry County | 119,341 | +71 | 203,922 | +18 | 239,866 | +20 | 286,950 |
Total Working Age Population:
Total Households:
Total Working Age Population:
Total Households:
Total Working Age Population:
Total Households: