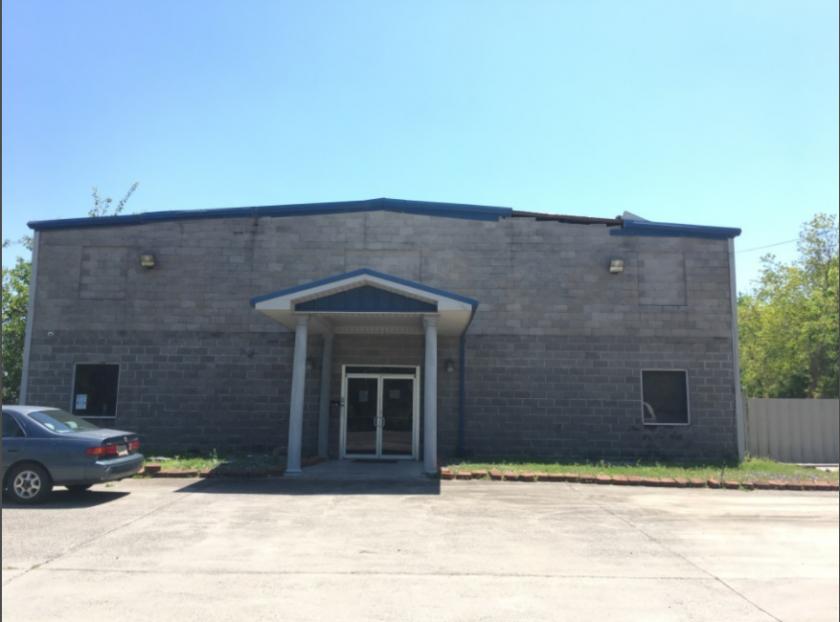
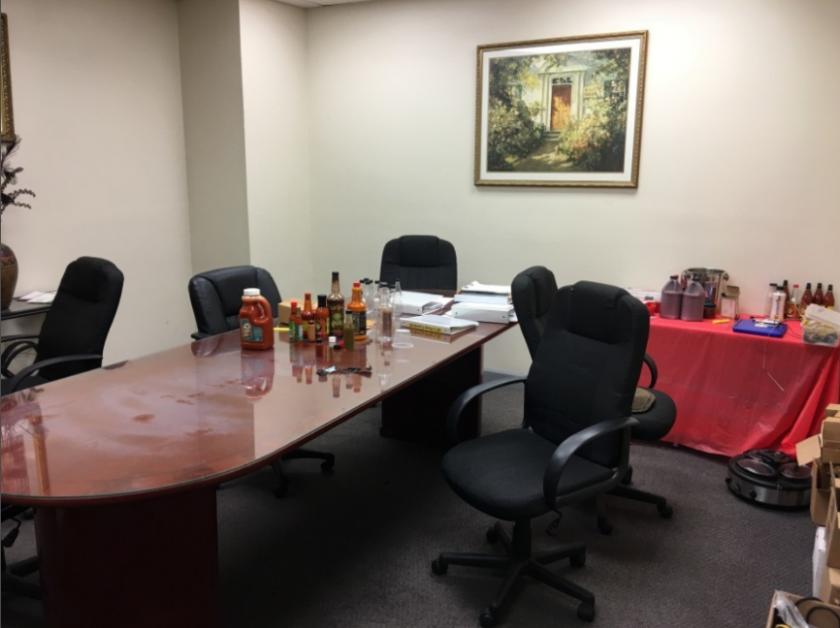
This property is located in an Opportunity Zone, which means it's ideal for either domestic investors or international E2, L1, or EB5 investors. Bridge Foods, Inc. filed and completed Chapter 11 a few years ago. The seller is VERY MOTIVATED to sell the real estate, trademark, and equipment either as a package or separately. Listing Agent is SFR Certified, so it is the agent's professional opinion that this is the opportune time to get a good deal from the bank on the real estate. This is of particular significance with it being in an Opportunity Zone valued at $700,000 and with a remaining loan value under $600,000. A savvy investor could flip this property for a hefty tax-free profit very quickly.Please note that, for real-estate-only offers, if the intended offer is less than the total loan value plus commission, Buyer must pay portion of commission for the remaining commission due because bank will not pay and because Seller will not have any remaining funds, so a Buyer should make an offer that also takes commission into consideration.Regarding other assets, Seller will pay commission at closing.Equipment is valued at $300,000 installed in place, $150,000 if moved.Trademark (Ashanti) is arbitrarily valued at $200,000. It has been registered since 1995. Seller is willing to include recipes, nutrition labels, and image copyrights for this amount. Seller is also willing to be hired.