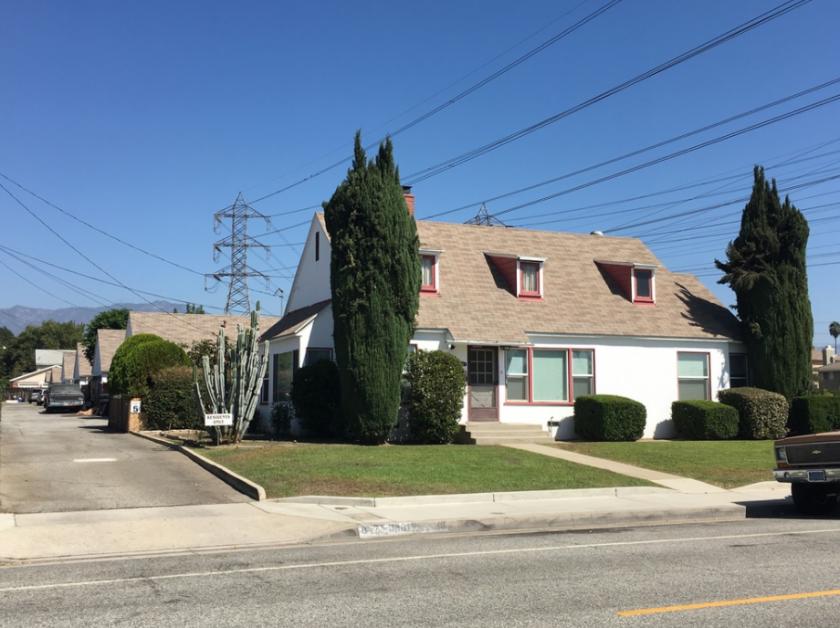
Multifamily Housing
8471 Wells Street Rosemead, CA 91770
8471 Wells Street Rosemead, CA 91770

Details & Description
Property Highlights
• CONVENIENT LOCATION near Emma W. Shuey Elementary School, Rosemead High School, Sally Tanner Park, and Valley Blvd
• RARE 6 UNITS MULTIFAMILY IN ROSEMEAD in the past 1 year, only 1 multifamily was sold in Rosemead 5 - 15 units
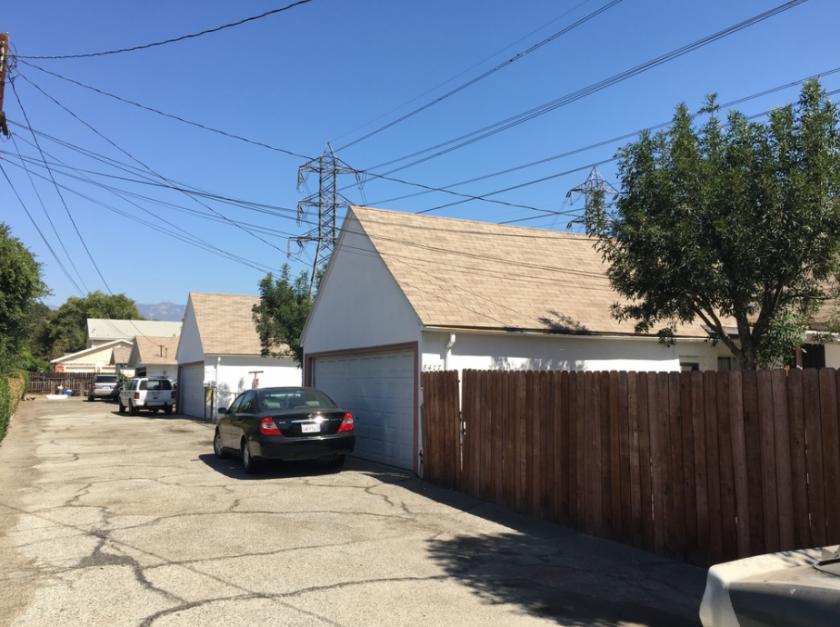
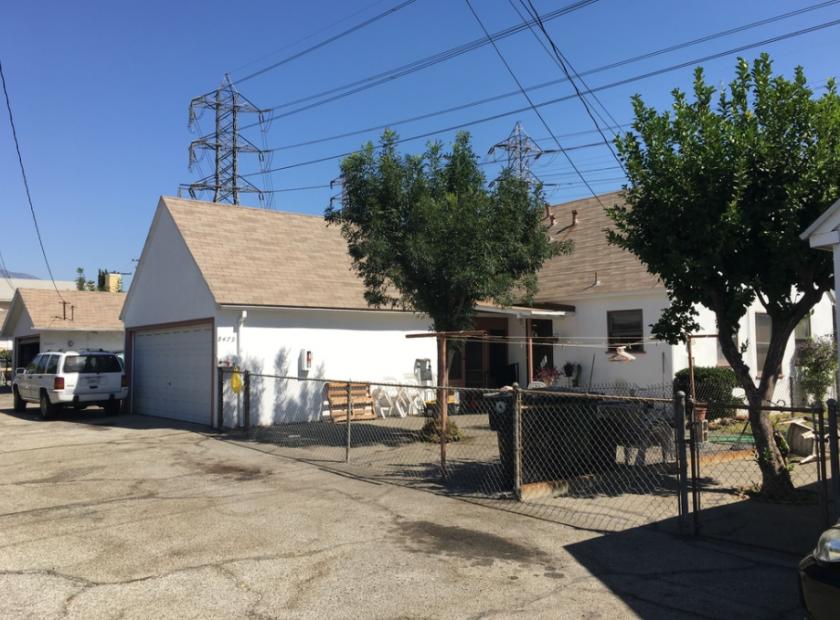
Additional Photos

Listing Agents

Steve Chang
KW Commerical
M: 626-491-2668
stevechang@kw.com
KW Commerical
M: 626-491-2668
stevechang@kw.com
While we strive to provide the most accurate information, all listing information, and demographic data, is provided by third-parties. As such, MyEListing will not be responsible for the accuracy of the information. It is strongly recommended that you verify all information with the listing agent, and any relevant agencies, prior to making any decisions.


