Multifamily Housing
401 West Main Street El Cajon, CA 92020
401 West Main Street El Cajon, CA 92020
Details & Description
Property Highlights
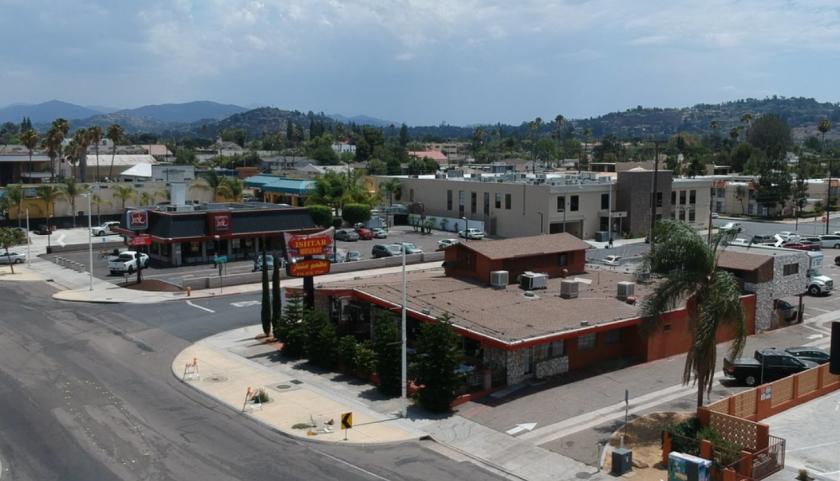
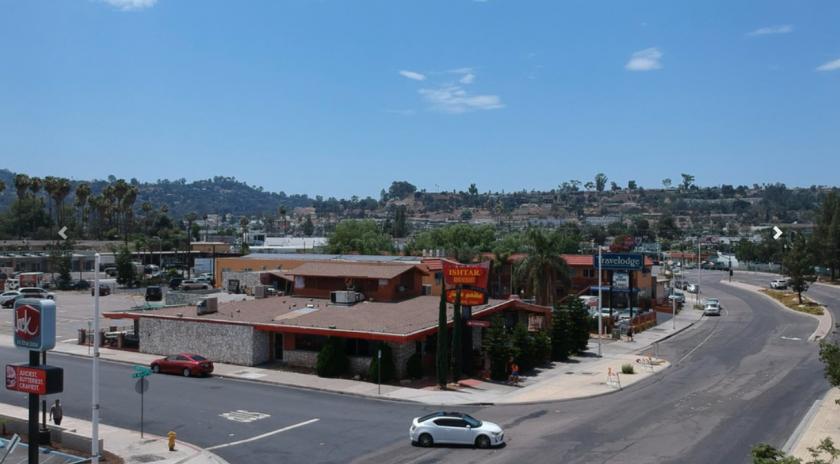
- • Infill mixed use site
- • Freeway access to all areas of San Diego County
- • Great walkability
- • Great downtown El Cajon location
- • City density bonuses for market rate development
Listing Agents

Jeff Davies
KW Commercial
O: 619-887-5270
daviescre@gmail.com
KW Commercial
O: 619-887-5270
daviescre@gmail.com
While we strive to provide the most accurate information, all listing information, and demographic data, is provided by third-parties. As such, MyEListing will not be responsible for the accuracy of the information. It is strongly recommended that you verify all information with the listing agent, and any relevant agencies, prior to making any decisions.