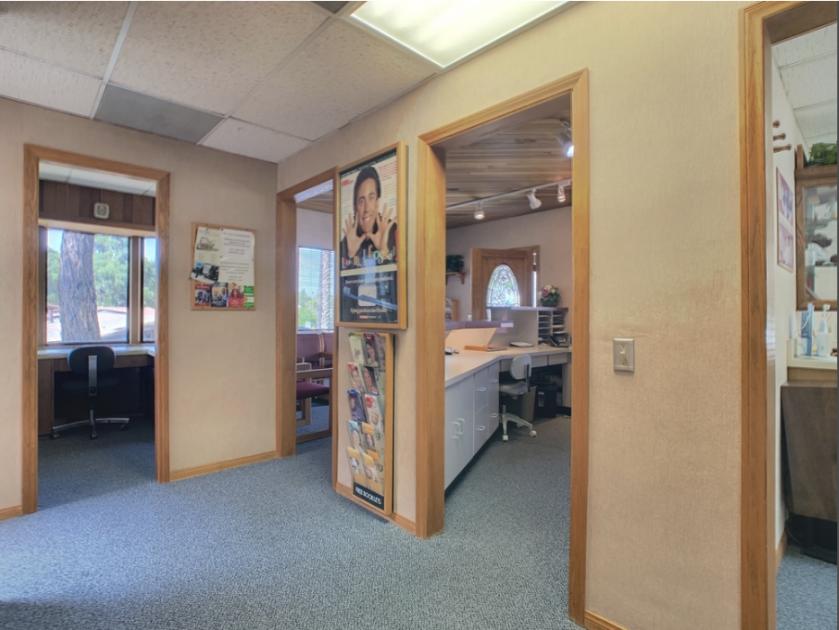
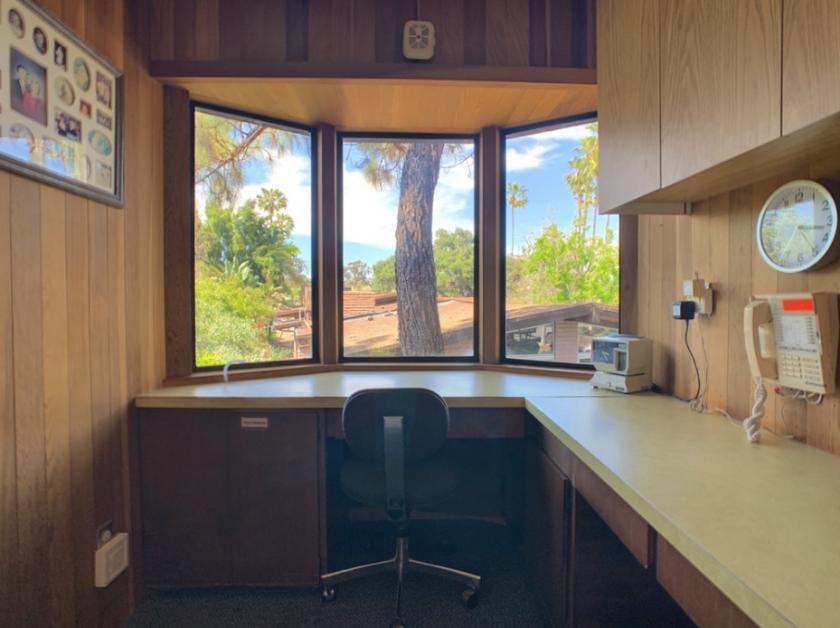
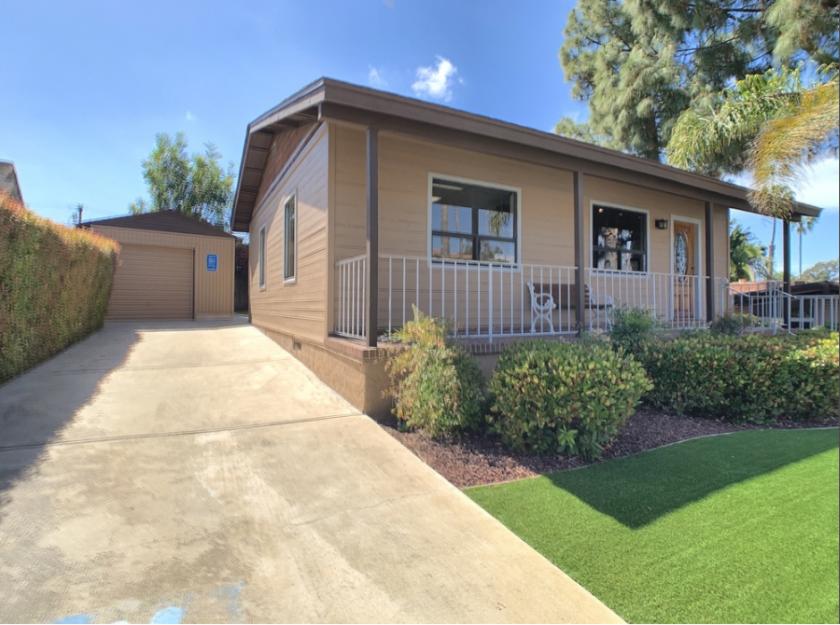
1-Mile | 3-Miles | 5-Miles | ||
---|---|---|---|---|
Total Population | 18,596 | 171,570 | 472,137 | |
Population Median Age | 39 | 38 | 37 | |
Population by Age | 0-9 Yrs | 1999 (10%) | 20951 (12%) | 60835 (12%) |
10-19 Yrs | 1719 (9%) | 19712 (11%) | 58786 (12%) | |
20-29 Yrs | 3204 (17%) | 30482 (17%) | 81481 (17%) | |
30-39 Yrs | 3029 (16%) | 25048 (14%) | 68046 (14%) | |
40-49 Yrs | 2410 (12%) | 20031 (11%) | 55563 (11%) | |
50-59 Yrs | 2237 (12%) | 20690 (12%) | 57704 (12%) | |
60-69 Yrs | 1861 (10%) | 17915 (10%) | 47094 (9%) | |
70+ Yrs | 2136 (11%) | 16741 (9%) | 42629 (9%) | |
Median HH Income | $61,891 | $68,879 | $65,132 | |
Total Household Income | < 24K | 1532 (19%) | 10171 (16%) | 28500 (18%) |
25-49K | 1611 (20%) | 11810 (19%) | 32048 (20%) | |
50-74K | 1275 (16%) | 10906 (17%) | 27949 (17%) | |
75-99K | 1133 (14%) | 8757 (14%) | 20961 (13%) | |
100-199K | 1735 (22%) | 14787 (24%) | 36409 (23%) | |
200K+ | 448 (5%) | 4541 (7%) | 10462 (6%) | |
Highest Education Level | No Diploma | 895 | 11619 | 45908 |
Diploma or GED | 2791 | 22322 | 68984 | |
Some College | 4002 | 30798 | 79359 | |
Assoc. Degree | 1055 | 9970 | 26100 | |
Bachelors Degree | 3354 | 25362 | 59020 | |
Higher Degree | 1678 | 15340 | 32653 | |
Total Housing Units | 8,208 | 64,230 | 164,613 | |
--Owner-Occupied | 2,582 | 30,809 | 78,676 | |
--Renter-Occupied | 5,152 | 30,164 | 77,652 | |
Owner-Occupied Values | < 100K | 37 | 815 | 4045 |
100-199K | 31 | 529 | 2132 | |
200-299K | 137 | 1563 | 5307 | |
300-399K | 239 | 3609 | 12327 | |
400-499K | 467 | 7561 | 19489 | |
500K+ | 1671 | 16733 | 35377 | |
Total Working Age Population | 15,482 | 139,155 | 377,817 | |
In Work Force | 10,250 | 91,036 | 243,764 | |
Not In Work Force | 5,232 | 48,118 | 134,053 | |
Workforce Employed | 9,259 | 83,721 | 222,044 | |
Workforce Unemployed | 743 | 5,956 | 17,786 | |
Civlian Workforce | 10,001 | 89,678 | 239,830 | |
Military Workforce | 249 | 1,358 | 3,934 | |
Total Households | 7,734 | 60,973 | 156,329 | |
Family Households | 4,327 | 39,324 | 106,751 | |
Non-Family Households | 3,406 | 21,648 | 49,577 | |
Married Couple | 2,955 | 28,018 | 73,941 | |
Other Family | 1,372 | 11,307 | 32,810 | |
Married w/Child | 1,232 | 11,836 | 32,001 | |
Single Male w/Child | 189 | 1,337 | 3,785 | |
Single Female w/Child | 456 | 4,026 | 11,079 |
Population Change Last Two Decades - Plus Projection
2000 | % | 2010 | % | 2020 | % | 2030 | |
---|---|---|---|---|---|---|---|
California | 33,871,648 | +10 | 37,253,956 | +9 | 40,467,295 | +8 | 43,631,295 |
San Diego County | 2,813,833 | +10 | 3,095,313 | +10 | 3,390,529 | +6 | 3,608,286 |
Total Working Age Population:
Total Households:
Total Working Age Population:
Total Households:
Total Working Age Population:
Total Households: