Specialty Real Estate
196 Dessecker Road Livingston Manor, NY 12758
196 Dessecker Road Livingston Manor, NY 12758
Details & Description
Property Highlights
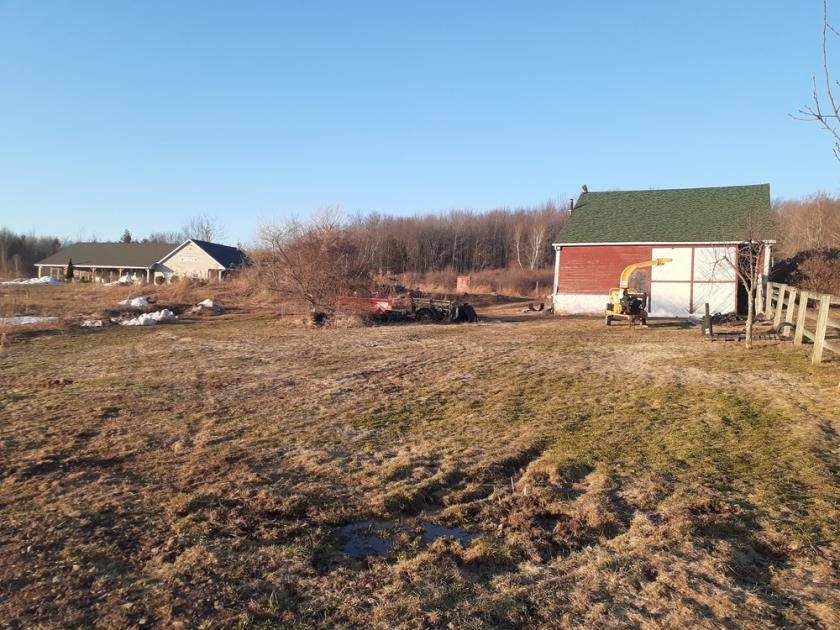
- • Beautiful Farmhouse Residence Barn
- • Hunting Preserve Embedded in 83 Acres
- • Add Cabins Campsites for Outdoor Recreation Sites
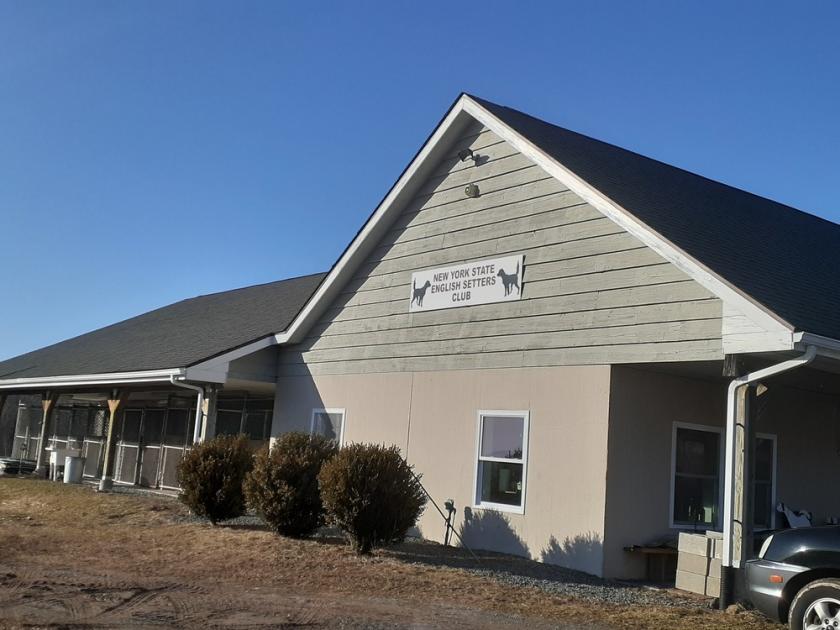
- • Dog Breeders Trainers Facility in Place
- • Ideal for Hunt Gun Club
- • Will Build to Suit
Listing Agents

Robert Donnelly
O: 201-391-2500
M: 914-649-8692
realestatebob61@gmail.com
O: 201-391-2500
M: 914-649-8692
realestatebob61@gmail.com
While we strive to provide the most accurate information, all listing information, and demographic data, is provided by third-parties. As such, MyEListing will not be responsible for the accuracy of the information. It is strongly recommended that you verify all information with the listing agent, and any relevant agencies, prior to making any decisions.