Flex-Office-Warehouse
14608 Old Gunpowder Road Laurel, MD 20707
14608 Old Gunpowder Road Laurel, MD 20707
Details & Description
Property Highlights
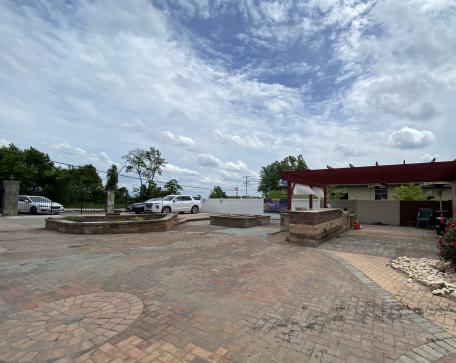
- • Private 18,034 SF .4 Acre fenced in yard
- • Additional 3,042 SF .07 Acre side lot
- • Minutes to I-95, Route 198, and MD-200
Listing Agents

Helen Dellheim
O: 410-312-0000
M: 410-258-4136
helen@wincommercial.com
O: 410-312-0000
M: 410-258-4136
helen@wincommercial.com
While we strive to provide the most accurate information, all listing information, and demographic data, is provided by third-parties. As such, MyEListing will not be responsible for the accuracy of the information. It is strongly recommended that you verify all information with the listing agent, and any relevant agencies, prior to making any decisions.