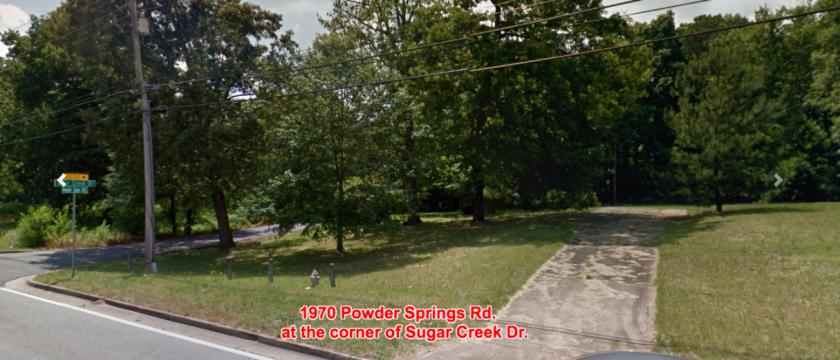
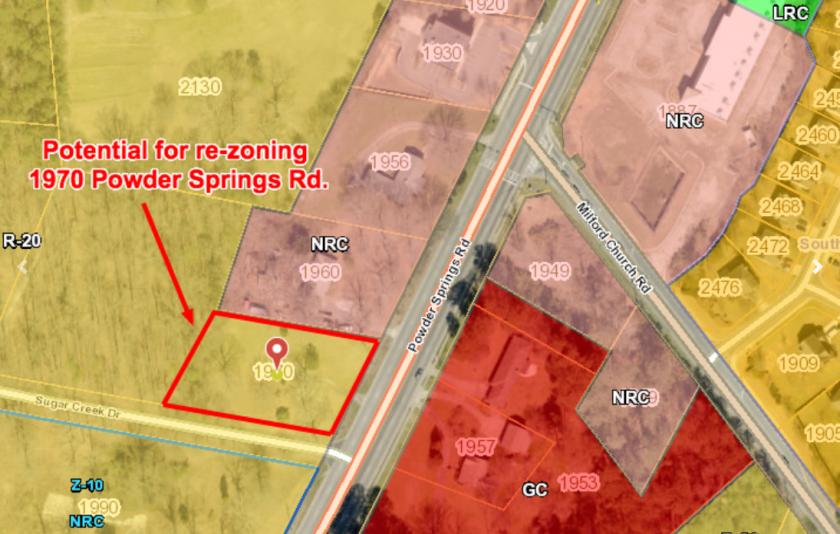
1-Mile | 3-Miles | 5-Miles | ||
---|---|---|---|---|
Total Population | 7,291 | 63,510 | 168,759 | |
Population Median Age | 35 | 36 | 37 | |
Population by Age | 0-9 Yrs | 1034 (14%) | 8661 (13%) | 23733 (14%) |
10-19 Yrs | 1180 (16%) | 9162 (14%) | 23187 (13%) | |
20-29 Yrs | 1026 (14%) | 8559 (13%) | 21717 (12%) | |
30-39 Yrs | 1334 (18%) | 9720 (15%) | 24939 (14%) | |
40-49 Yrs | 696 (9%) | 7920 (12%) | 22953 (13%) | |
50-59 Yrs | 855 (11%) | 8536 (13%) | 22879 (13%) | |
60-69 Yrs | 460 (6%) | 5530 (8%) | 16000 (9%) | |
70+ Yrs | 706 (9%) | 5423 (8%) | 13352 (7%) | |
Median HH Income | $59,141 | $65,628 | $66,089 | |
Total Household Income | < 24K | 432 (17%) | 3416 (15%) | 8909 (15%) |
25-49K | 621 (24%) | 4726 (21%) | 13105 (22%) | |
50-74K | 493 (19%) | 4538 (20%) | 11270 (19%) | |
75-99K | 207 (8%) | 3131 (14%) | 8079 (13%) | |
100-199K | 689 (27%) | 5312 (24%) | 14010 (23%) | |
200K+ | 68 (2%) | 1008 (4%) | 3299 (5%) | |
Highest Education Level | No Diploma | 564 | 4918 | 14599 |
Diploma or GED | 1336 | 11430 | 28753 | |
Some College | 1028 | 8331 | 22428 | |
Assoc. Degree | 395 | 3681 | 8895 | |
Bachelors Degree | 860 | 8900 | 24298 | |
Higher Degree | 354 | 4160 | 12544 | |
Total Housing Units | 2,708 | 23,286 | 62,543 | |
--Owner-Occupied | 1,928 | 15,222 | 38,909 | |
--Renter-Occupied | 582 | 6,909 | 19,764 | |
Owner-Occupied Values | < 100K | 176 | 1750 | 4433 |
100-199K | 1220 | 7424 | 16375 | |
200-299K | 414 | 4385 | 10491 | |
300-399K | 78 | 1054 | 4496 | |
400-499K | 13 | 299 | 1691 | |
500K+ | 27 | 309 | 1423 | |
Total Working Age Population | 5,453 | 49,242 | 130,609 | |
In Work Force | 3,447 | 32,826 | 88,098 | |
Not In Work Force | 2,006 | 16,416 | 42,511 | |
Workforce Employed | 3,344 | 31,311 | 83,770 | |
Workforce Unemployed | 102 | 1,499 | 4,255 | |
Civlian Workforce | 3,447 | 32,810 | 88,025 | |
Military Workforce | 0 | 16 | 73 | |
Total Households | 2,510 | 22,131 | 58,673 | |
Family Households | 1,731 | 15,583 | 42,025 | |
Non-Family Households | 779 | 6,547 | 16,648 | |
Married Couple | 1,237 | 10,339 | 28,456 | |
Other Family | 494 | 5,244 | 13,570 | |
Married w/Child | 585 | 4,777 | 12,185 | |
Single Male w/Child | 34 | 514 | 1,362 | |
Single Female w/Child | 259 | 2,284 | 5,752 |
Population Change Last Two Decades - Plus Projection
2000 | % | 2010 | % | 2020 | % | 2030 | |
---|---|---|---|---|---|---|---|
Georgia | 8,186,453 | +18 | 9,687,653 | +12 | 10,833,472 | +13 | 12,292,423 |
Cobb County | 607,751 | +13 | 688,078 | +15 | 790,588 | +19 | 938,747 |
Fulton County | 816,006 | +13 | 920,581 | +19 | 1,099,181 | +18 | 1,300,861 |
Total Working Age Population:
Total Households:
Total Working Age Population:
Total Households:
Total Working Age Population:
Total Households: