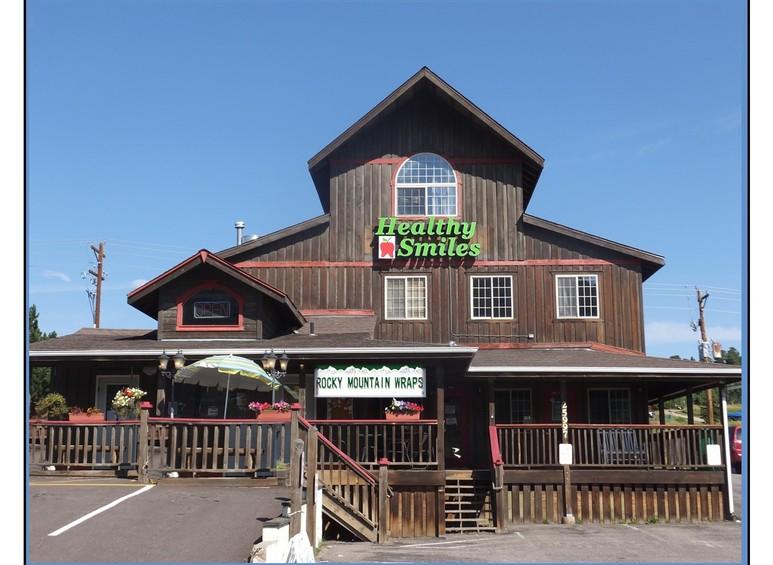
Retail Space
25997 Conifer Road Conifer, CO 80433
25997 Conifer Road Conifer, CO 80433
Details & Description
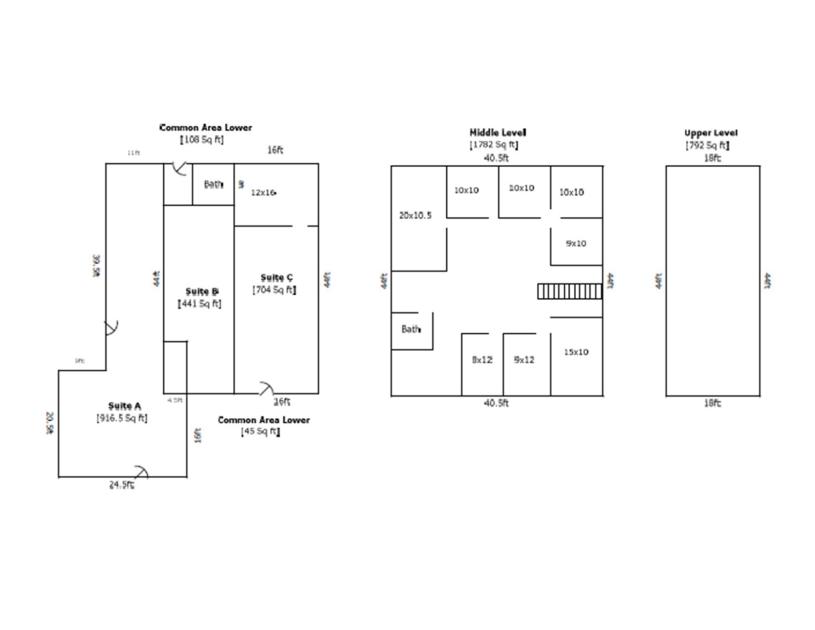
Property Highlights
• Conveniently located in the heart of Aspen Park, this building has several suites and offices currently available.
• The upstairs units enjoy a shared common area includes reception, conference room, kitchen and bathroom.
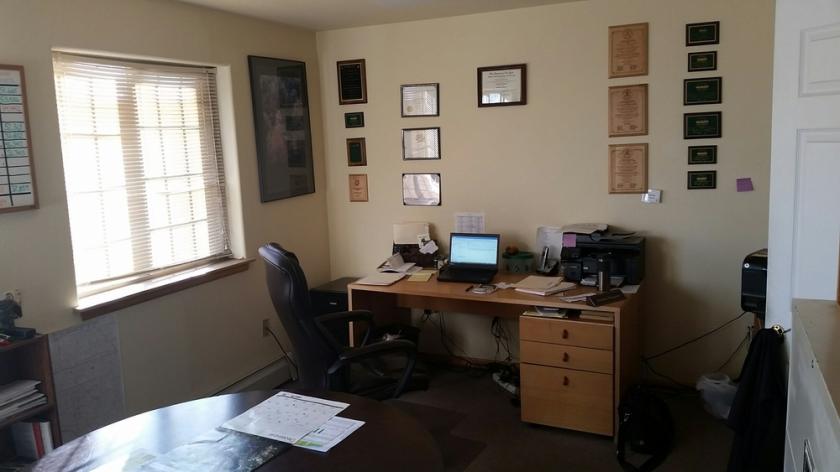
Additional Photos

Listing Agents

William Downes
M: 303-880-9880
admin@evergreencommercial.net
M: 303-880-9880
admin@evergreencommercial.net
While we strive to provide the most accurate information, all listing information, and demographic data, is provided by third-parties. As such, MyEListing will not be responsible for the accuracy of the information. It is strongly recommended that you verify all information with the listing agent, and any relevant agencies, prior to making any decisions.


