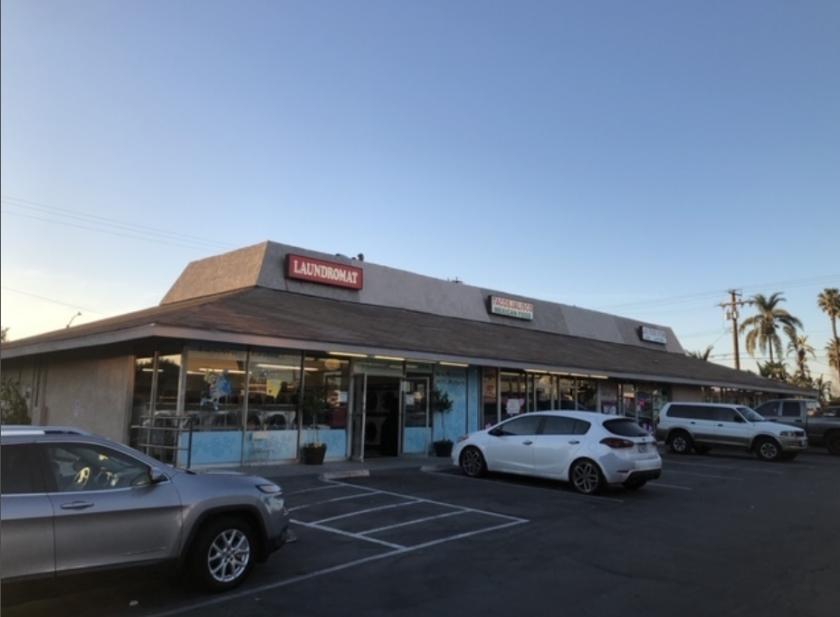
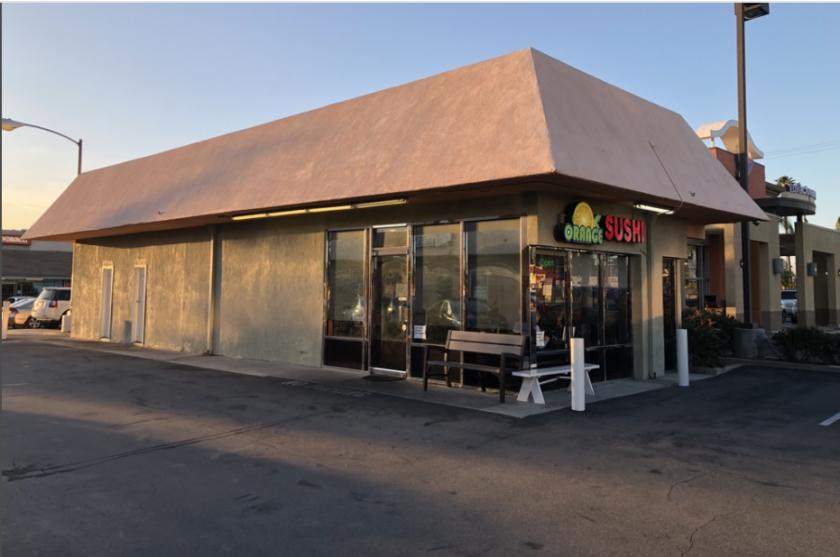
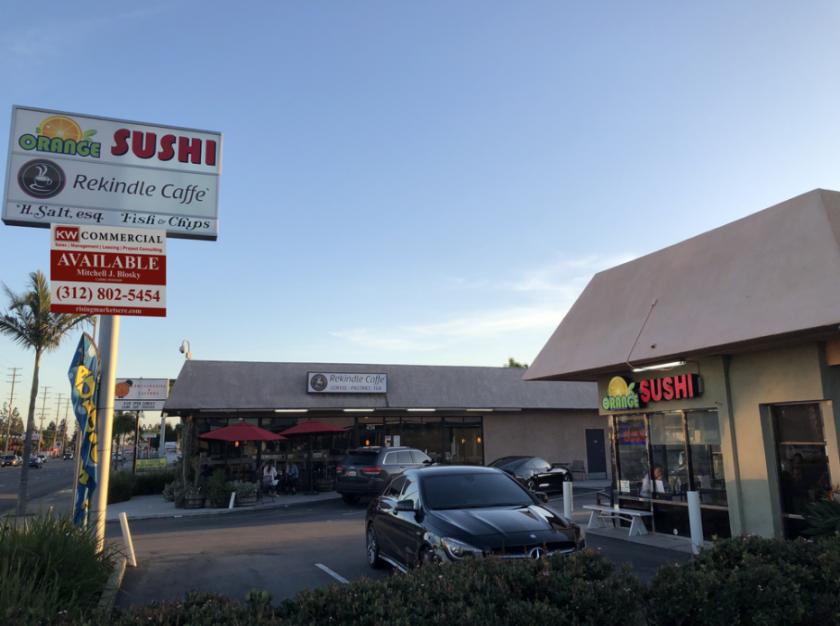
1-Mile | 3-Miles | 5-Miles | ||
---|---|---|---|---|
Total Population | 27,398 | 172,480 | 541,358 | |
Population Median Age | 34 | 38 | 36 | |
Population by Age | 0-9 Yrs | 3271 (11%) | 20168 (11%) | 73751 (13%) |
10-19 Yrs | 4807 (17%) | 22252 (12%) | 75723 (13%) | |
20-29 Yrs | 5409 (19%) | 28907 (16%) | 87519 (16%) | |
30-39 Yrs | 3532 (12%) | 24037 (13%) | 79544 (14%) | |
40-49 Yrs | 3028 (11%) | 22449 (13%) | 72148 (13%) | |
50-59 Yrs | 3139 (11%) | 22265 (12%) | 66513 (12%) | |
60-69 Yrs | 2230 (8%) | 16346 (9%) | 44748 (8%) | |
70+ Yrs | 1983 (7%) | 16056 (9%) | 41413 (7%) | |
Median HH Income | $84,541 | $88,946 | $79,302 | |
Total Household Income | < 24K | 986 (12%) | 6027 (11%) | 19023 (12%) |
25-49K | 1337 (17%) | 8075 (15%) | 26597 (17%) | |
50-74K | 1095 (14%) | 8831 (16%) | 27137 (17%) | |
75-99K | 1250 (16%) | 6847 (12%) | 20151 (13%) | |
100-199K | 2297 (29%) | 16656 (31%) | 41766 (27%) | |
200K+ | 825 (10%) | 7070 (13%) | 17777 (11%) | |
Highest Education Level | No Diploma | 2434 | 18809 | 85628 |
Diploma or GED | 2989 | 21767 | 71037 | |
Some College | 3724 | 25506 | 69683 | |
Assoc. Degree | 1230 | 8680 | 22166 | |
Bachelors Degree | 3930 | 27274 | 68470 | |
Higher Degree | 1560 | 13344 | 33642 | |
Total Housing Units | 8,171 | 55,878 | 159,370 | |
--Owner-Occupied | 4,212 | 31,293 | 77,955 | |
--Renter-Occupied | 3,578 | 22,213 | 74,495 | |
Owner-Occupied Values | < 100K | 111 | 993 | 3100 |
100-199K | 39 | 412 | 1047 | |
200-299K | 84 | 859 | 2487 | |
300-399K | 138 | 1633 | 5748 | |
400-499K | 304 | 2621 | 9748 | |
500K+ | 3535 | 24775 | 55825 | |
Total Working Age Population | 22,462 | 140,094 | 422,486 | |
In Work Force | 13,954 | 92,414 | 282,654 | |
Not In Work Force | 8,507 | 47,680 | 139,832 | |
Workforce Employed | 13,413 | 88,535 | 269,075 | |
Workforce Unemployed | 541 | 3,863 | 13,489 | |
Civlian Workforce | 13,954 | 92,398 | 282,565 | |
Military Workforce | 0 | 16 | 90 | |
Total Households | 7,789 | 53,506 | 152,450 | |
Family Households | 5,651 | 38,887 | 116,113 | |
Non-Family Households | 2,138 | 14,619 | 36,337 | |
Married Couple | 4,169 | 29,604 | 84,474 | |
Other Family | 1,482 | 9,283 | 31,639 | |
Married w/Child | 1,892 | 12,344 | 39,684 | |
Single Male w/Child | 205 | 1,093 | 4,041 | |
Single Female w/Child | 402 | 2,750 | 10,374 |
Population Change Last Two Decades - Plus Projection
2000 | % | 2010 | % | 2020 | % | 2030 | |
---|---|---|---|---|---|---|---|
California | 33,871,648 | +10 | 37,253,956 | +9 | 40,467,295 | +8 | 43,631,295 |
Los Angeles County | 9,519,338 | +3 | 9,818,605 | +6 | 10,369,367 | +4 | 10,759,850 |
Orange County | 2,846,289 | +6 | 3,010,232 | +8 | 3,257,087 | +5 | 3,431,096 |
Total Working Age Population:
Total Households:
Total Working Age Population:
Total Households:
Total Working Age Population:
Total Households: