Specialty Real Estate
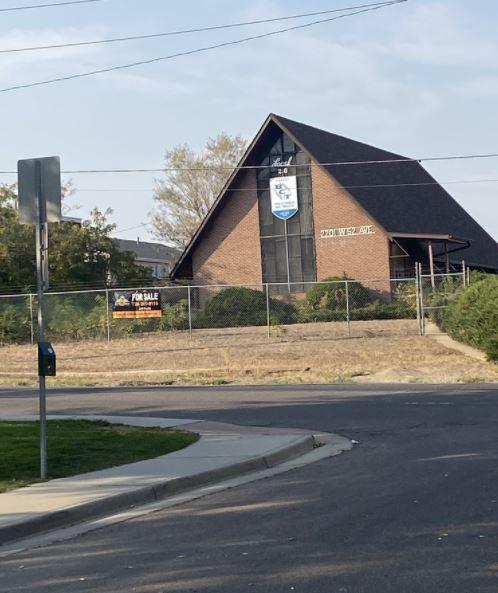
2201 West 52nd Avenue Denver, CO 80221
2201 West 52nd Avenue Denver, CO 80221
Details & Description
Property Highlights
• Priced at land value-- Get the existing building for FREE
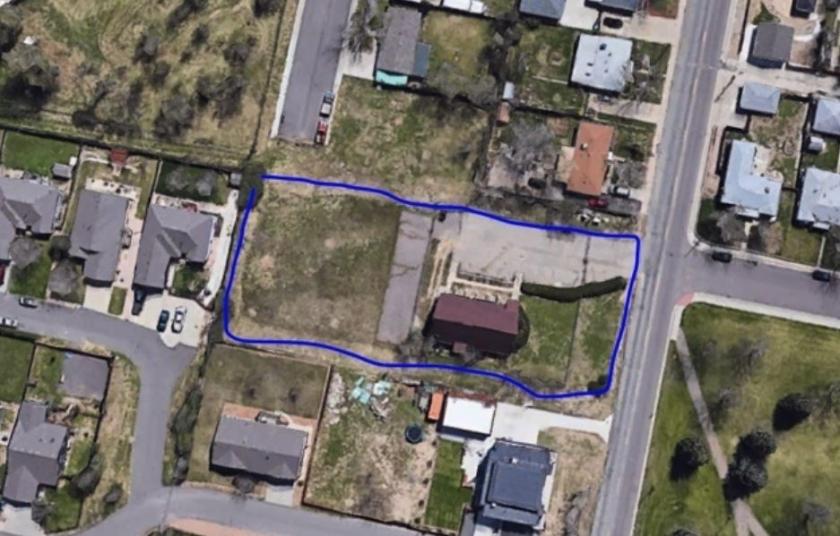
• Great In-fill Commercial Land in Denver
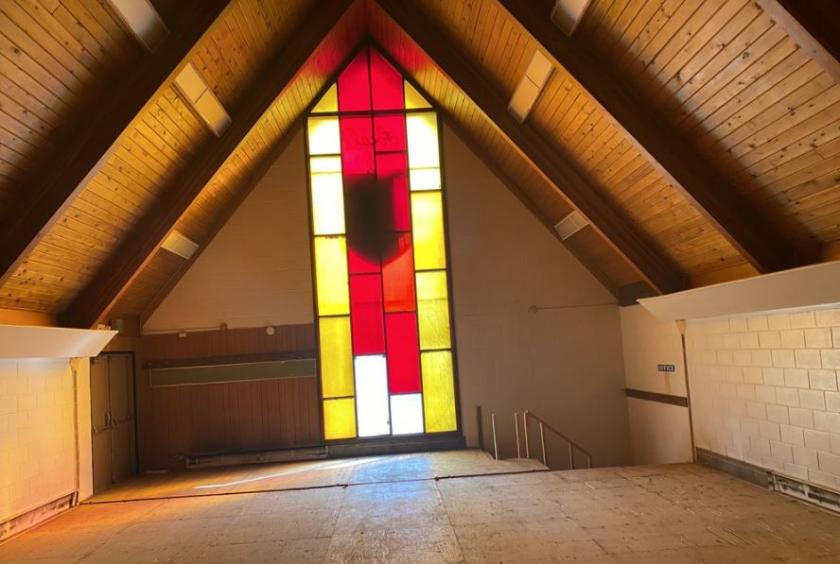
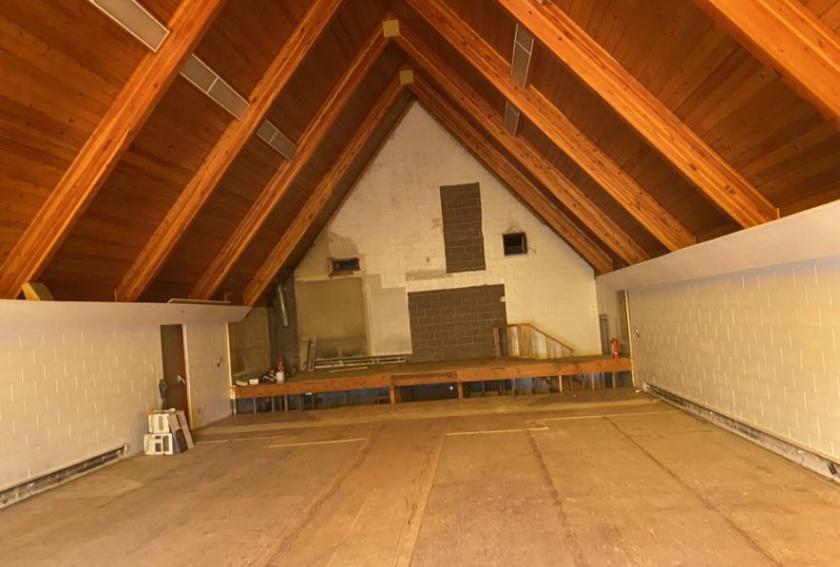
Additional Photos
Listing Agents

Jeff Coutts
KW Commercial
O: 720-341-8118
mrsoldmakesdeals@gmail.com
KW Commercial
O: 720-341-8118
mrsoldmakesdeals@gmail.com
While we strive to provide the most accurate information, all listing information, and demographic data, is provided by third-parties. As such, MyEListing will not be responsible for the accuracy of the information. It is strongly recommended that you verify all information with the listing agent, and any relevant agencies, prior to making any decisions.


