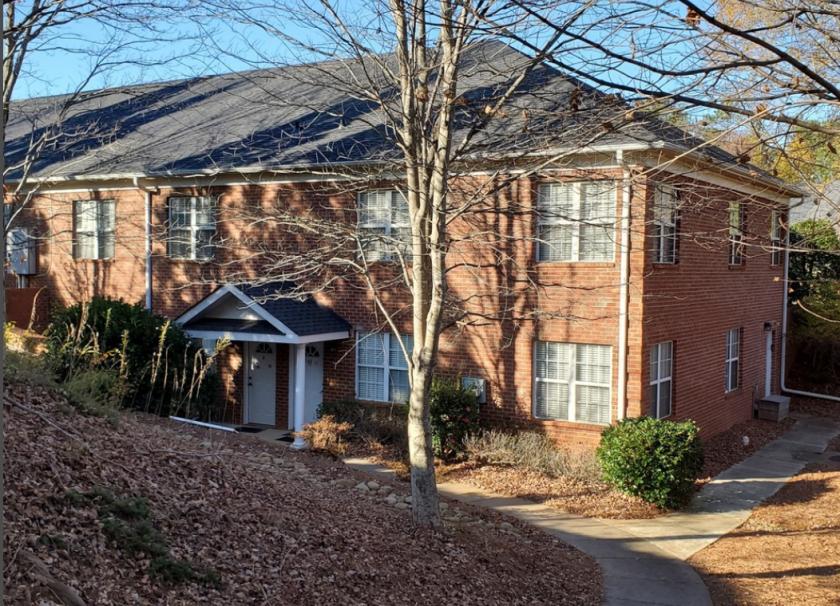
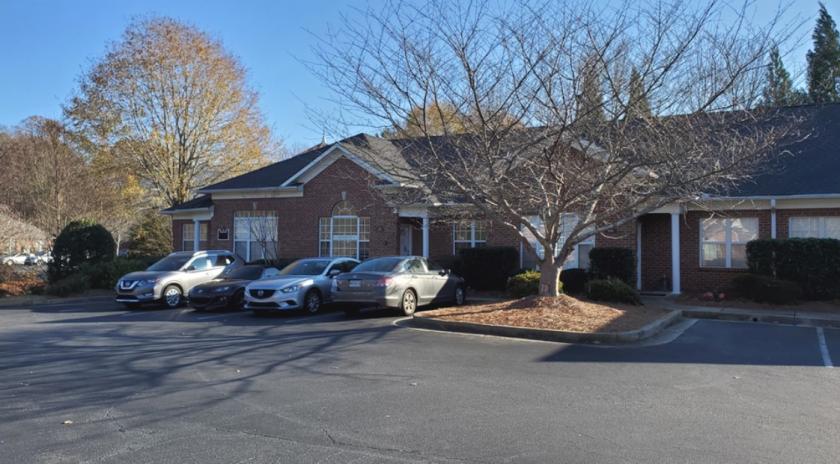
1-Mile | 3-Miles | 5-Miles | ||
---|---|---|---|---|
Total Population | 9,242 | 84,991 | 200,594 | |
Population Median Age | 35 | 36 | 37 | |
Population by Age | 0-9 Yrs | 1240 (13%) | 11259 (13%) | 26576 (13%) |
10-19 Yrs | 1514 (16%) | 13201 (15%) | 30892 (15%) | |
20-29 Yrs | 902 (9%) | 7465 (8%) | 17415 (8%) | |
30-39 Yrs | 1455 (15%) | 12163 (14%) | 28807 (14%) | |
40-49 Yrs | 1446 (15%) | 14899 (17%) | 34178 (17%) | |
50-59 Yrs | 1718 (18%) | 14718 (17%) | 31852 (15%) | |
60-69 Yrs | 493 (5%) | 7467 (8%) | 19548 (9%) | |
70+ Yrs | 475 (5%) | 3818 (4%) | 11327 (5%) | |
Median HH Income | $106,524 | $117,491 | $112,737 | |
Total Household Income | < 24K | 274 (8%) | 2157 (7%) | 5007 (7%) |
25-49K | 462 (13%) | 3453 (11%) | 8827 (12%) | |
50-74K | 502 (15%) | 3701 (12%) | 9376 (13%) | |
75-99K | 334 (10%) | 3246 (10%) | 7972 (11%) | |
100-199K | 1048 (31%) | 10169 (34%) | 24283 (34%) | |
200K+ | 717 (21%) | 7175 (23%) | 15583 (21%) | |
Highest Education Level | No Diploma | 136 | 2167 | 5754 |
Diploma or GED | 520 | 5568 | 13527 | |
Some College | 775 | 7020 | 18683 | |
Assoc. Degree | 338 | 2818 | 7443 | |
Bachelors Degree | 2485 | 23451 | 53104 | |
Higher Degree | 1885 | 16008 | 36046 | |
Total Housing Units | 3,567 | 31,771 | 75,196 | |
--Owner-Occupied | 2,043 | 20,409 | 49,064 | |
--Renter-Occupied | 1,294 | 9,493 | 21,985 | |
Owner-Occupied Values | < 100K | 88 | 448 | 1081 |
100-199K | 240 | 1476 | 3891 | |
200-299K | 370 | 3840 | 8988 | |
300-399K | 274 | 4468 | 11667 | |
400-499K | 484 | 3797 | 9165 | |
500K+ | 587 | 6379 | 14271 | |
Total Working Age Population | 7,026 | 65,001 | 154,055 | |
In Work Force | 4,974 | 46,986 | 110,138 | |
Not In Work Force | 2,052 | 18,015 | 43,917 | |
Workforce Employed | 4,726 | 44,861 | 105,446 | |
Workforce Unemployed | 249 | 2,083 | 4,568 | |
Civlian Workforce | 4,974 | 46,944 | 110,014 | |
Military Workforce | 0 | 42 | 124 | |
Total Households | 3,337 | 29,902 | 71,049 | |
Family Households | 2,303 | 22,490 | 53,395 | |
Non-Family Households | 1,034 | 7,412 | 17,654 | |
Married Couple | 1,973 | 19,263 | 45,076 | |
Other Family | 330 | 3,227 | 8,319 | |
Married w/Child | 1,257 | 10,727 | 24,601 | |
Single Male w/Child | 25 | 597 | 1,347 | |
Single Female w/Child | 166 | 1,392 | 3,844 |
Population Change Last Two Decades - Plus Projection
2000 | % | 2010 | % | 2020 | % | 2030 | |
---|---|---|---|---|---|---|---|
Georgia | 8,186,453 | +18 | 9,687,653 | +12 | 10,833,472 | +13 | 12,292,423 |
Cherokee County | 141,903 | +51 | 214,346 | +24 | 266,617 | +20 | 320,849 |
Forsyth County | 98,407 | +78 | 175,511 | +44 | 252,507 | +35 | 341,646 |
Fulton County | 816,006 | +13 | 920,581 | +19 | 1,099,181 | +18 | 1,300,861 |
Gwinnett County | 588,448 | +37 | 805,321 | +21 | 971,145 | +21 | 1,175,358 |
Total Working Age Population:
Total Households:
Total Working Age Population:
Total Households:
Total Working Age Population:
Total Households: