Office Space
3 Chester Pike Darby, PA 19023
3 Chester Pike Darby, PA 19023
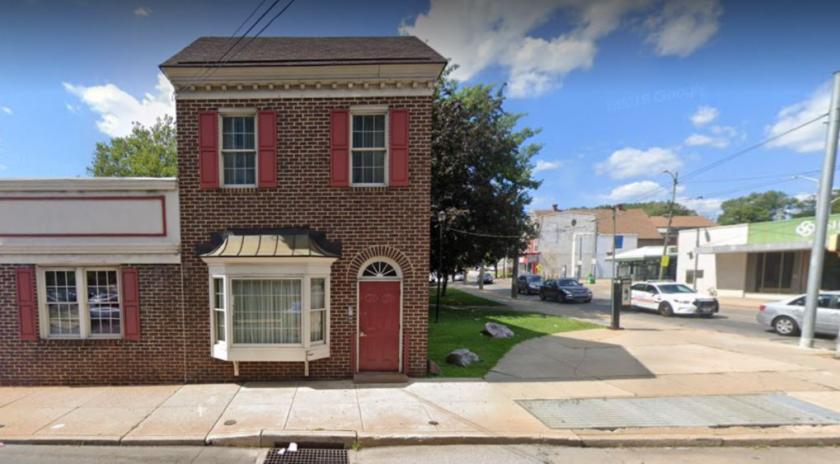
Details & Description
Property Highlights
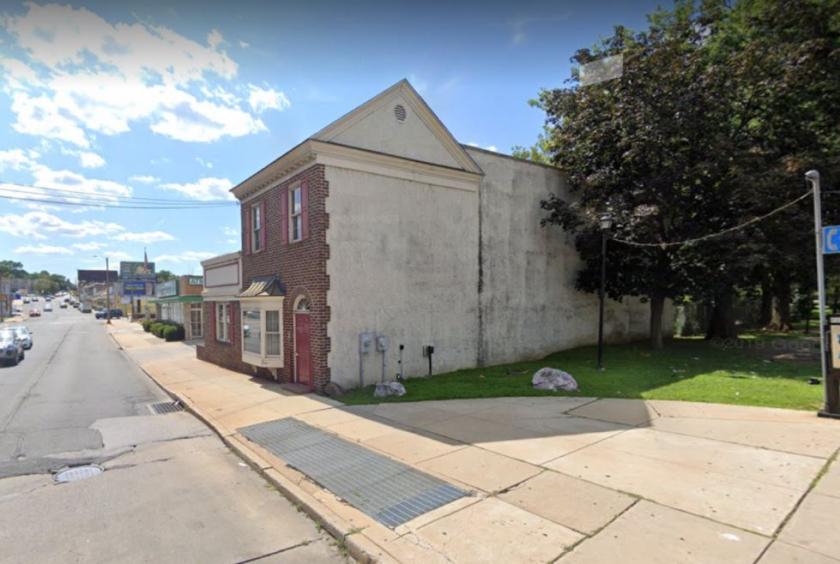
- • High Traffic
- • Parking Lot SEPTA Accessible
- • Commercial Business District
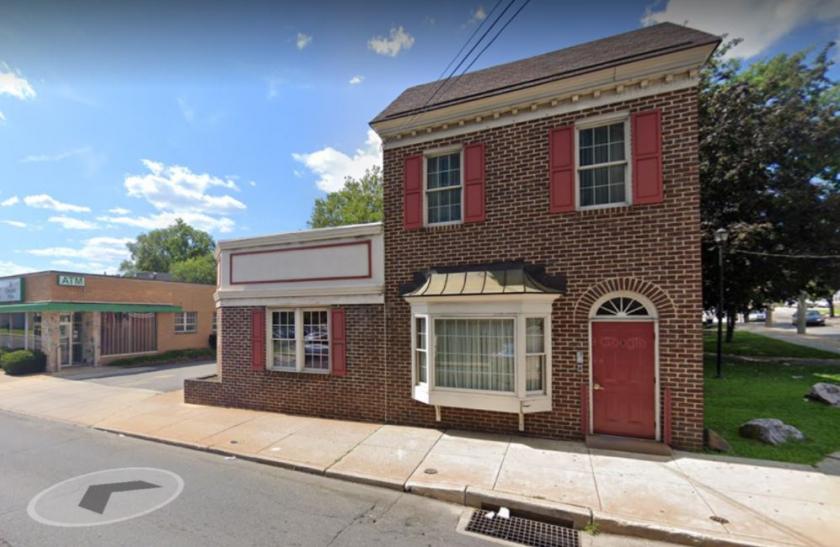
- • Office Space Retail Use
- • Package Purchase Option
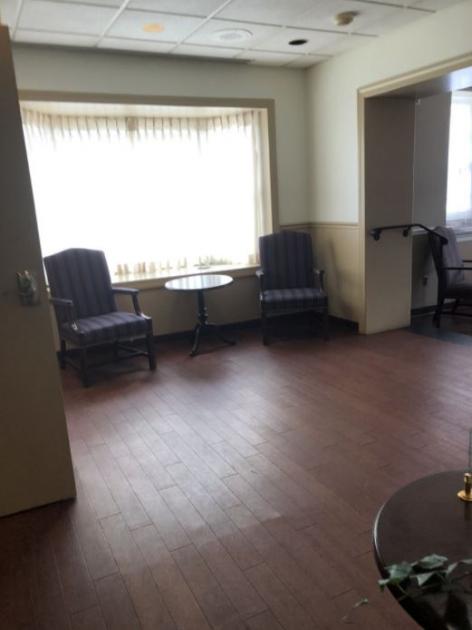
Additional Photos
Listing Agents

Mark Andrade
KW Commercial
O: 646-797-1816
M: 267-238-5735
mark.andrade@kw.com
KW Commercial
O: 646-797-1816
M: 267-238-5735
mark.andrade@kw.com
While we strive to provide the most accurate information, all listing information, and demographic data, is provided by third-parties. As such, MyEListing will not be responsible for the accuracy of the information. It is strongly recommended that you verify all information with the listing agent, and any relevant agencies, prior to making any decisions.


