32 Unit Portfolio in Philadelphia Market
100 Unit Occupancy
90 of units under market rent - $33,588 in potential additional rental income
Landlord pays utilities, ability to assign to tenants - $17,980 in potential additional income
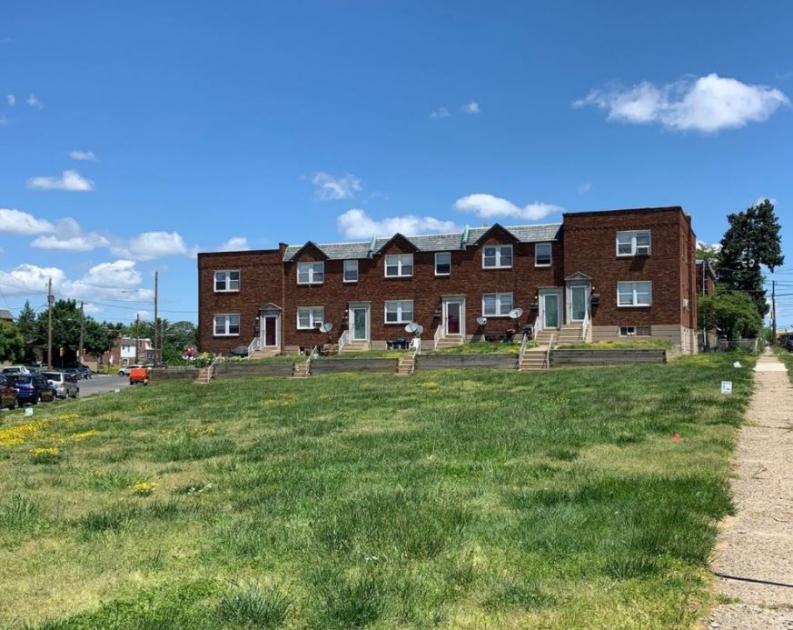
Potential Additional Unit Development up to 30 units RSA5 Zoning
All three properties within 3 minute drive of one another for reduced management cost
Located in High Score walkability and transportation areas
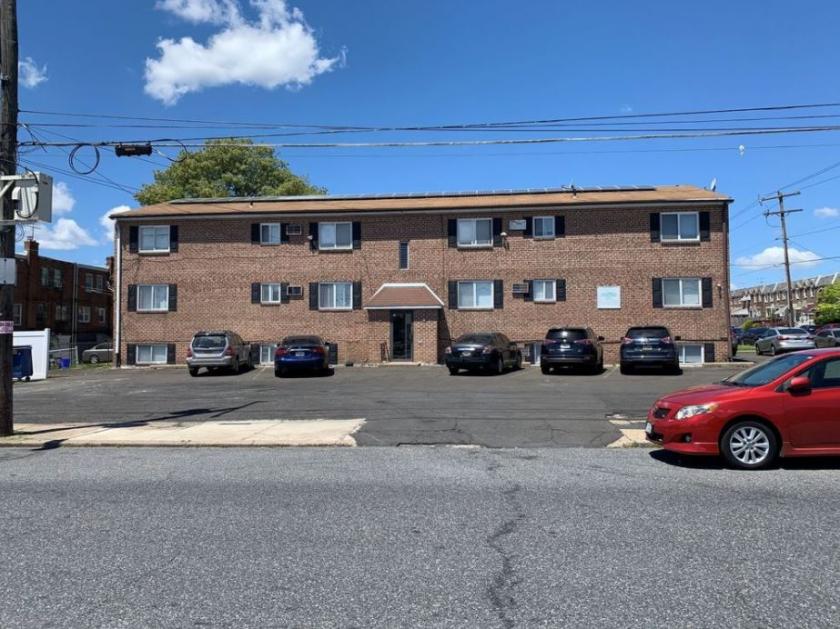
Dedicated Parking Lots 10-16 spaces at each property totaling 40 spaces Ample non-metered street parking
Solar Energy Panels being utilized at Devereaux Ave and Frankford Ave properties
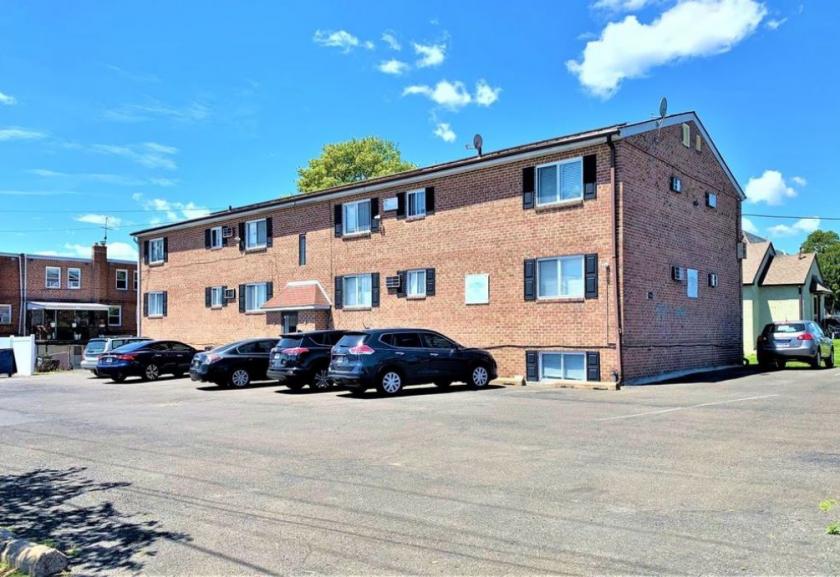
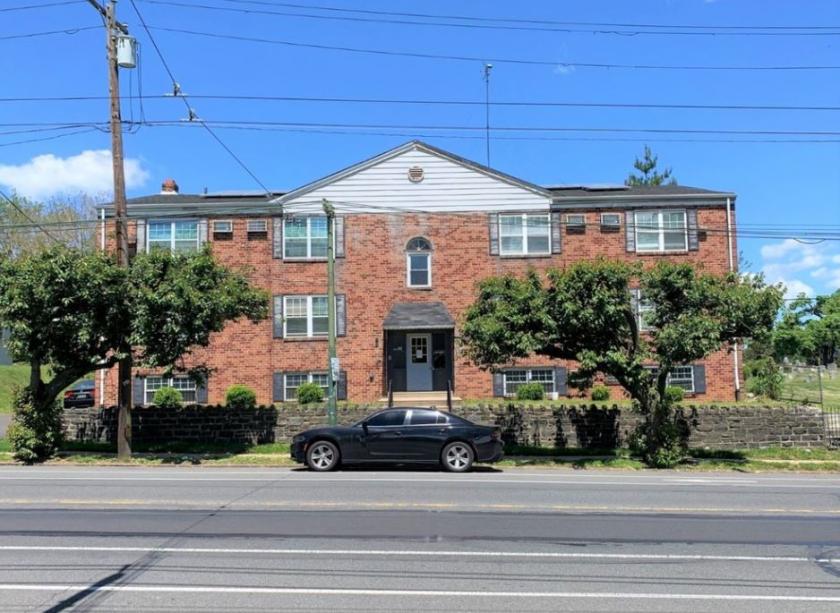
KW Commercial is pleased to present a unique Value Add Multifamily Portfolio in the heart of Northeast Philadelphia. The portfolio consists of three separate buildings all located within a three minute drive of one another.
The unit breakdown among the three buildings are:
11 units in Devereaux Ave which consists of all 1 bed / 1 bath.
10 units in 6311-19 Everett Ave which consists of five (5) 1 bed / 1 bath and five (5) 2 bed / 1 bath as well as a garage rental unit.
11 Units units in 5766 Frankford Ave which consists of all 1 bed / 1 bath
The portfolio is at 100% occupancy and located in an area with high walking and transportation scores.
This portfolio has massive value add. All but three units are currently under market rent which gives the investor upside potential of up to $33,588 in additional annual rental income. The investor could also assign all utilities to tenants (currently paid by Landlord) which would lower the operating expenses and provide up to $17,980 in potential additional income, Totaling up to $51,568 in additional income in the short term. Another value add component included in this deal is in relation to 6311-19 Everett Ave. There are currently 10 Units fully occupied, however there is a large portion of the parcel that is raw land. The parcel is zoned RSA5, Construction of additional units is possible. (RSA-5 districts are primarily intended to accommodate attached and semi-detached houses on individual lots and can accommodate up to 30 units, but may be applied in areas characterized by a mix of housing types, including detached houses. Single-family dwellings do not require zoning approval. Other uses require either a use registration permit from the Department of Licenses and Inspection or a special exception or a variance from the Zoning Board of Adjustment Variance uses include: Two Family and Multifamily dwellings).
No part of this information may be copied, reproduced, repurposed, or screen-captured for any commercial purpose without prior written authorization from MyEListing.
While we strive to provide the most accurate information, all listing information, and demographic data, is provided by third-parties. As such, MyEListing will not be responsible for the accuracy of the information. It is strongly recommended that you verify all information with the listing agent, and any relevant agencies, prior to making any decisions.
What is the asking price for 2946 Devereaux Avenue in Philadelphia?
The asking price for 2946 Devereaux Avenue is $3,990,000
What is the building size of this Multifamily property in Philadelphia, PA?
The size of the building/unit at 2946 Devereaux Avenue in Philadelphia is 29,066 square feet
How much land does the Philadelphia, PA property at 2946 Devereaux Avenue include?
2946 Devereaux Avenue in Philadelphia includes 0.970 acres of land
What is the population within 1 mile of 2946 Devereaux Avenue in Philadelphia?
The population within 1 mile of 2946 Devereaux Avenue Philadelphia, PA 19149 is 70,195 people.
Who do I contact for questions about 2946 Devereaux Avenue?
You should contact the listing agent,
Brady Carroll , for any details regarding this commercial listing.