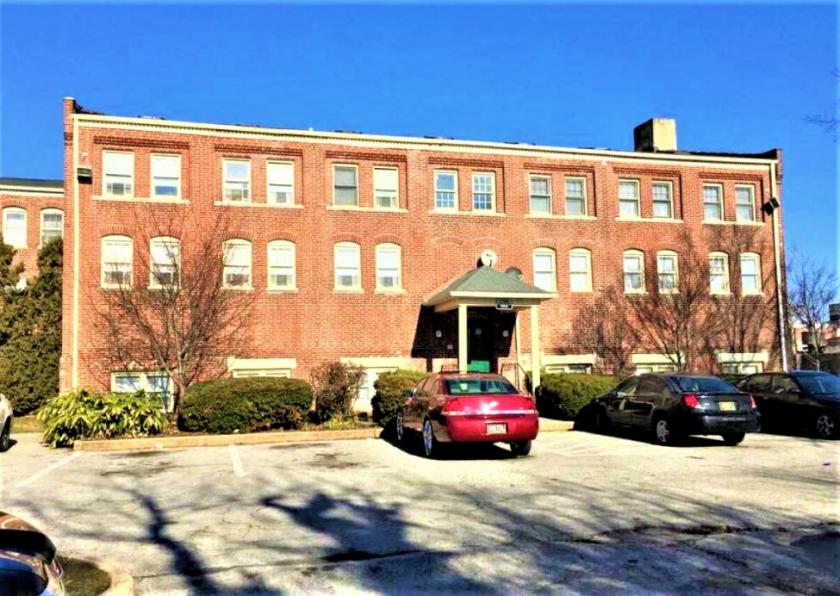
Multifamily Housing
400 North West Street Wilmington, DE 19801
400 North West Street Wilmington, DE 19801
Details & Description
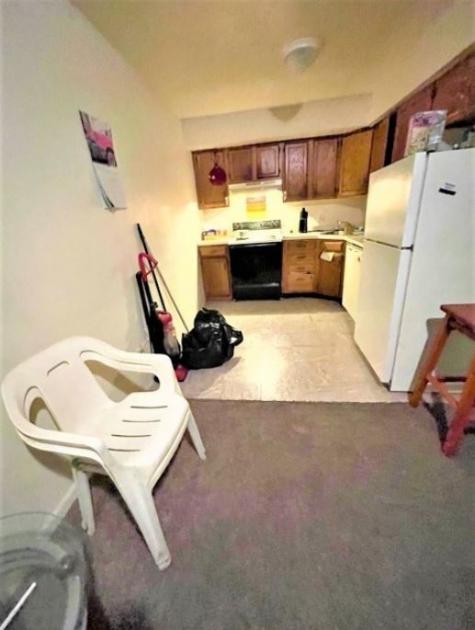
Additional Photos


Listing Agents

Brady Carroll
KW Commercial
O: 610-291-9895
bcarroll@kwcommercial.com
KW Commercial
O: 610-291-9895
bcarroll@kwcommercial.com
While we strive to provide the most accurate information, all listing information, and demographic data, is provided by third-parties. As such, MyEListing will not be responsible for the accuracy of the information. It is strongly recommended that you verify all information with the listing agent, and any relevant agencies, prior to making any decisions.


