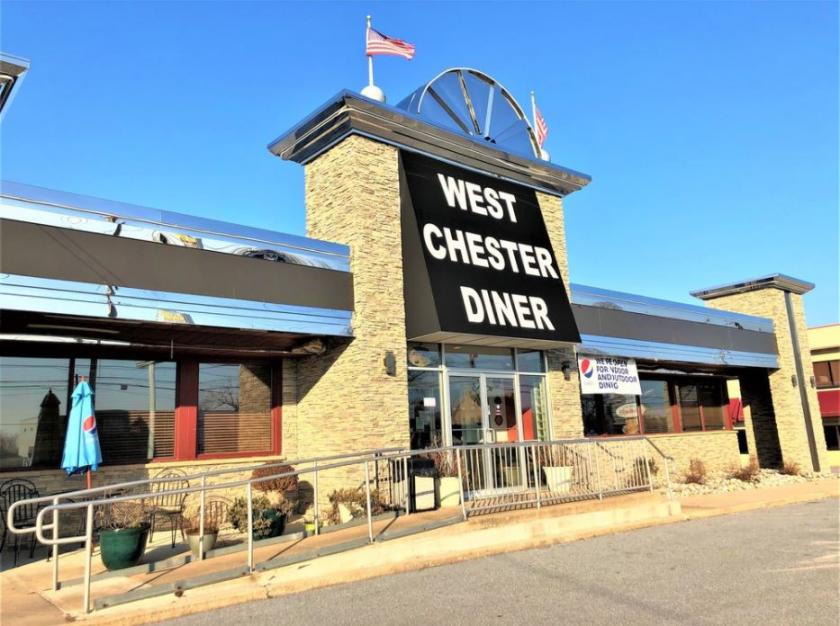
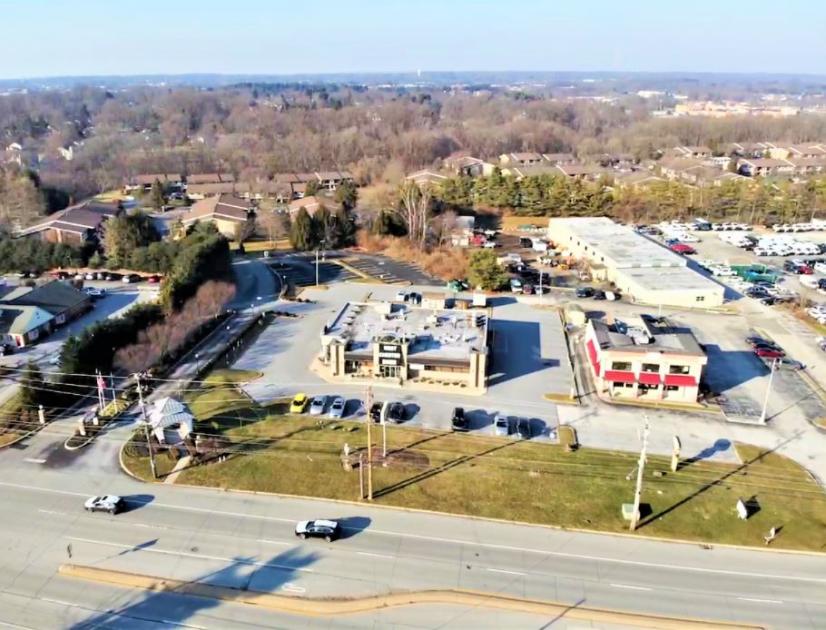
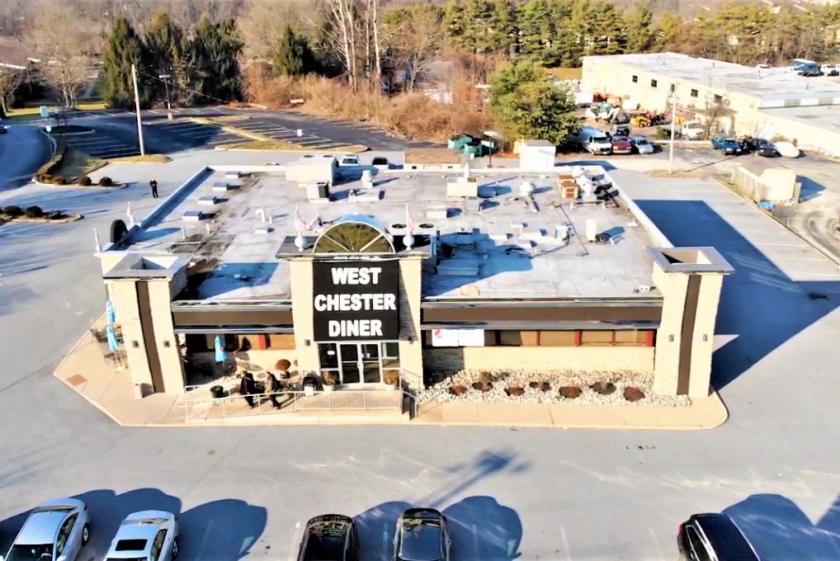
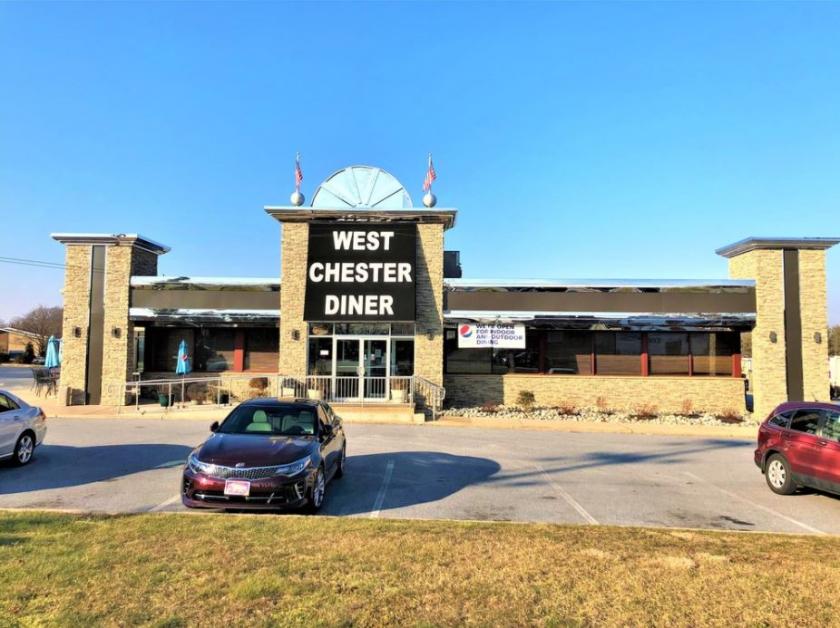
1-Mile | 3-Miles | 5-Miles | ||
---|---|---|---|---|
Total Population | 9,463 | 66,068 | 114,760 | |
Population Median Age | 40 | 39 | 40 | |
Population by Age | 0-9 Yrs | 1014 (10%) | 6046 (9%) | 11317 (9%) |
10-19 Yrs | 888 (9%) | 8839 (13%) | 15988 (13%) | |
20-29 Yrs | 1815 (19%) | 13496 (20%) | 18548 (16%) | |
30-39 Yrs | 1189 (12%) | 7606 (11%) | 13108 (11%) | |
40-49 Yrs | 1196 (12%) | 6701 (10%) | 12934 (11%) | |
50-59 Yrs | 1201 (12%) | 8095 (12%) | 15632 (13%) | |
60-69 Yrs | 1121 (11%) | 7660 (11%) | 14509 (12%) | |
70+ Yrs | 1040 (10%) | 7624 (11%) | 12724 (11%) | |
Median HH Income | $85,091 | $85,684 | $102,410 | |
Total Household Income | < 24K | 659 (17%) | 3876 (14%) | 4795 (11%) |
25-49K | 558 (14%) | 4175 (15%) | 6032 (13%) | |
50-74K | 505 (13%) | 3626 (13%) | 5324 (12%) | |
75-99K | 522 (13%) | 3316 (12%) | 5143 (11%) | |
100-199K | 1126 (29%) | 7353 (28%) | 13467 (30%) | |
200K+ | 495 (12%) | 3842 (14%) | 8702 (20%) | |
Highest Education Level | No Diploma | 331 | 1518 | 2577 |
Diploma or GED | 1245 | 7913 | 12131 | |
Some College | 852 | 5530 | 9891 | |
Assoc. Degree | 339 | 2523 | 4752 | |
Bachelors Degree | 2125 | 15277 | 27672 | |
Higher Degree | 1484 | 9803 | 18953 | |
Total Housing Units | 4,081 | 27,503 | 45,320 | |
--Owner-Occupied | 2,222 | 15,863 | 30,603 | |
--Renter-Occupied | 1,642 | 10,323 | 12,860 | |
Owner-Occupied Values | < 100K | 65 | 315 | 433 |
100-199K | 157 | 1245 | 1633 | |
200-299K | 343 | 2616 | 5024 | |
300-399K | 882 | 3975 | 6914 | |
400-499K | 505 | 3616 | 6560 | |
500K+ | 269 | 4097 | 10039 | |
Total Working Age Population | 7,924 | 56,587 | 96,047 | |
In Work Force | 5,572 | 37,945 | 65,098 | |
Not In Work Force | 2,352 | 18,641 | 30,949 | |
Workforce Employed | 5,374 | 36,411 | 62,546 | |
Workforce Unemployed | 198 | 1,519 | 2,493 | |
Civlian Workforce | 5,571 | 37,930 | 65,039 | |
Military Workforce | 0 | 15 | 58 | |
Total Households | 3,865 | 26,186 | 43,463 | |
Family Households | 2,364 | 14,860 | 27,942 | |
Non-Family Households | 1,500 | 11,326 | 15,521 | |
Married Couple | 1,981 | 12,347 | 23,550 | |
Other Family | 383 | 2,513 | 4,392 | |
Married w/Child | 785 | 4,574 | 9,038 | |
Single Male w/Child | 71 | 285 | 529 | |
Single Female w/Child | 110 | 829 | 1,407 |
Population Change Last Two Decades - Plus Projection
2000 | % | 2010 | % | 2020 | % | 2030 | |
---|---|---|---|---|---|---|---|
Pennsylvania | 12,281,054 | +3 | 12,702,379 | +4 | 13,230,170 | +4 | 13,759,594 |
Chester County | 433,501 | +15 | 498,886 | +7 | 533,837 | +7 | 573,576 |
Delaware County | 550,864 | +1 | 558,979 | +5 | 588,436 | +6 | 622,307 |
Montgomery County | 750,097 | +7 | 799,874 | +5 | 838,883 | +6 | 891,868 |
Total Working Age Population:
Total Households:
Total Working Age Population:
Total Households:
Total Working Age Population:
Total Households: