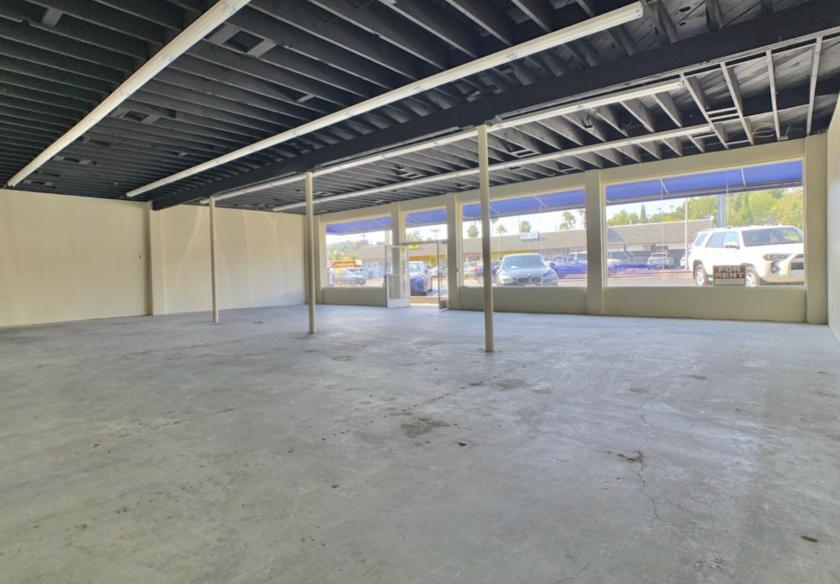
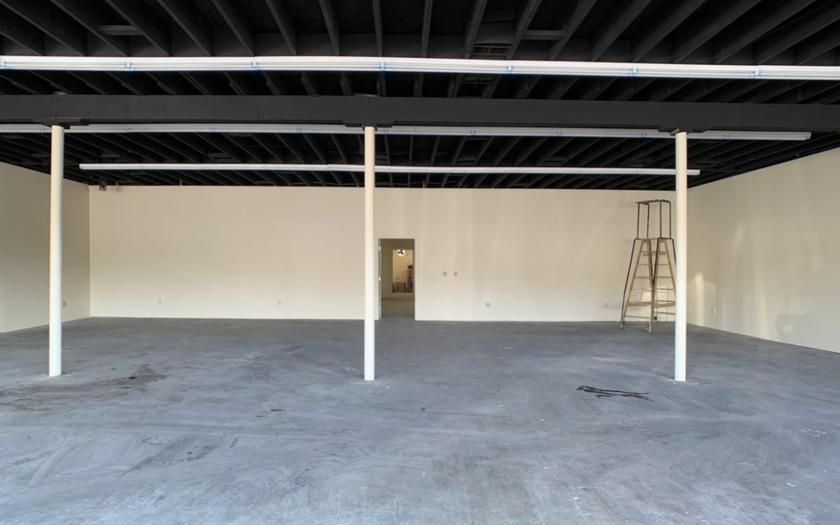
Retail Space
9927 Campo Road Spring Valley, CA 91977
9927 Campo Road Spring Valley, CA 91977
Details & Description
Property Highlights
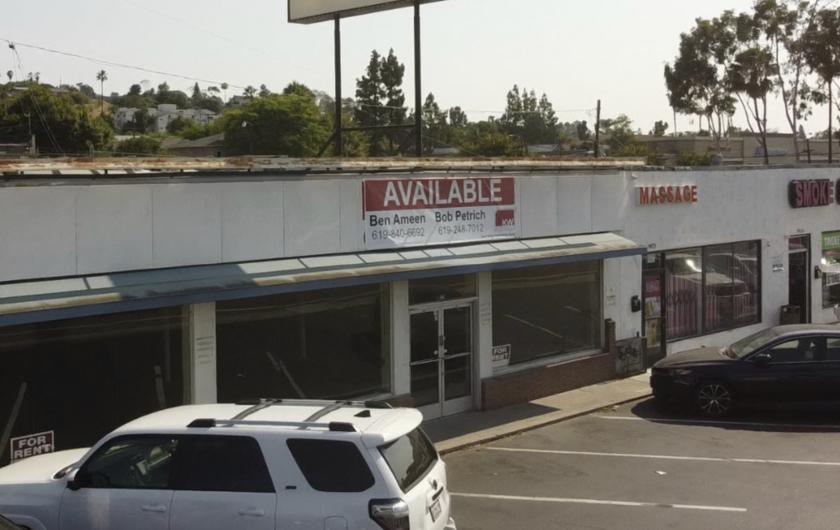
• Excellent Spring Valley Retail Location with great Street visibility on Campo Rd.
• Very busy location with excellent traffic count
Listing Agents

Ben Ameen
KW Commercial
O: 619-840-6692
bensdcommercial@gmail.com
KW Commercial
O: 619-840-6692
bensdcommercial@gmail.com
While we strive to provide the most accurate information, all listing information, and demographic data, is provided by third-parties. As such, MyEListing will not be responsible for the accuracy of the information. It is strongly recommended that you verify all information with the listing agent, and any relevant agencies, prior to making any decisions.