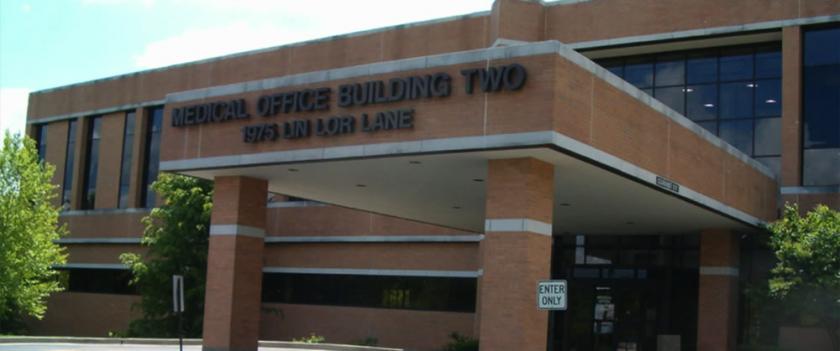
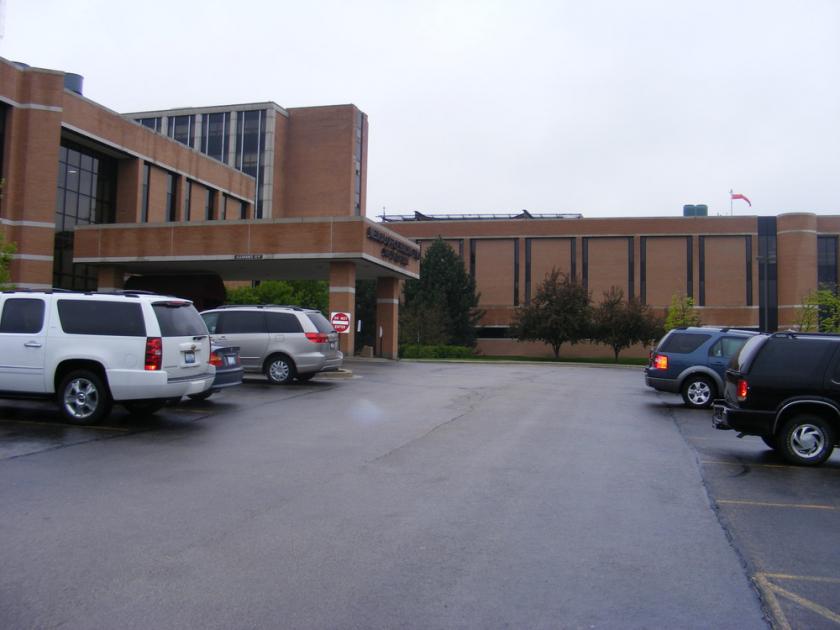
1-Mile | 3-Miles | 5-Miles | ||
---|---|---|---|---|
Total Population | 11,496 | 86,214 | 162,463 | |
Population Median Age | 40 | 37 | 37 | |
Population by Age | 0-9 Yrs | 1568 (13%) | 12110 (14%) | 22328 (13%) |
10-19 Yrs | 1239 (10%) | 12294 (14%) | 23904 (14%) | |
20-29 Yrs | 1229 (10%) | 10959 (12%) | 20238 (12%) | |
30-39 Yrs | 1546 (13%) | 11877 (13%) | 22385 (13%) | |
40-49 Yrs | 1456 (12%) | 11101 (12%) | 21728 (13%) | |
50-59 Yrs | 1499 (13%) | 11049 (12%) | 21763 (13%) | |
60-69 Yrs | 1683 (14%) | 9148 (10%) | 16962 (10%) | |
70+ Yrs | 1277 (11%) | 7675 (8%) | 13155 (8%) | |
Median HH Income | $63,993 | $71,632 | $78,307 | |
Total Household Income | < 24K | 552 (13%) | 4409 (14%) | 7030 (12%) |
25-49K | 947 (23%) | 5864 (19%) | 10181 (18%) | |
50-74K | 831 (20%) | 5038 (17%) | 8976 (16%) | |
75-99K | 591 (14%) | 4479 (15%) | 8026 (14%) | |
100-199K | 973 (23%) | 8023 (27%) | 15940 (29%) | |
200K+ | 181 (4%) | 1610 (5%) | 4345 (7%) | |
Highest Education Level | No Diploma | 1352 | 10701 | 17719 |
Diploma or GED | 2075 | 13385 | 25550 | |
Some College | 1955 | 13100 | 23343 | |
Assoc. Degree | 767 | 4762 | 8741 | |
Bachelors Degree | 1190 | 9288 | 20396 | |
Higher Degree | 744 | 5249 | 10468 | |
Total Housing Units | 4,254 | 31,166 | 57,422 | |
--Owner-Occupied | 2,773 | 20,015 | 39,891 | |
--Renter-Occupied | 1,301 | 9,408 | 14,608 | |
Owner-Occupied Values | < 100K | 163 | 1783 | 3081 |
100-199K | 1264 | 8716 | 15000 | |
200-299K | 965 | 6202 | 12599 | |
300-399K | 312 | 2592 | 6081 | |
400-499K | 33 | 418 | 1806 | |
500K+ | 36 | 304 | 1324 | |
Total Working Age Population | 9,100 | 67,213 | 126,024 | |
In Work Force | 5,831 | 45,497 | 86,924 | |
Not In Work Force | 3,269 | 21,716 | 39,100 | |
Workforce Employed | 5,429 | 42,966 | 82,371 | |
Workforce Unemployed | 402 | 2,522 | 4,544 | |
Civlian Workforce | 5,831 | 45,488 | 86,915 | |
Military Workforce | 0 | 9 | 9 | |
Total Households | 4,074 | 29,423 | 54,498 | |
Family Households | 2,869 | 21,035 | 39,945 | |
Non-Family Households | 1,205 | 8,388 | 14,554 | |
Married Couple | 2,065 | 15,287 | 30,408 | |
Other Family | 804 | 5,748 | 9,537 | |
Married w/Child | 790 | 6,424 | 13,734 | |
Single Male w/Child | 176 | 808 | 1,461 | |
Single Female w/Child | 274 | 2,502 | 3,938 |
Population Change Last Two Decades - Plus Projection
2000 | % | 2010 | % | 2020 | % | 2030 | |
---|---|---|---|---|---|---|---|
Illinois | 12,419,293 | +3 | 12,830,632 | +12 | 14,316,487 | +6 | 15,138,849 |
Cook County | 5,376,741 | -3 | 5,194,675 | +10 | 5,707,832 | +5 | 5,990,243 |
DuPage County | 904,161 | +1 | 916,924 | +10 | 1,010,323 | +2 | 1,034,039 |
Kane County | 404,119 | +28 | 515,269 | +22 | 630,563 | +8 | 679,403 |
Total Working Age Population:
Total Households:
Total Working Age Population:
Total Households:
Total Working Age Population:
Total Households: