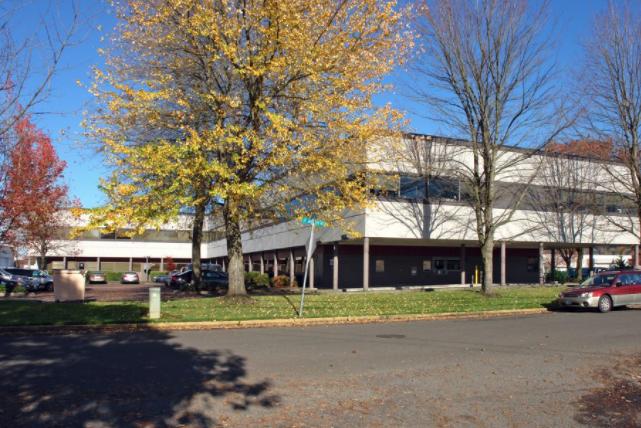
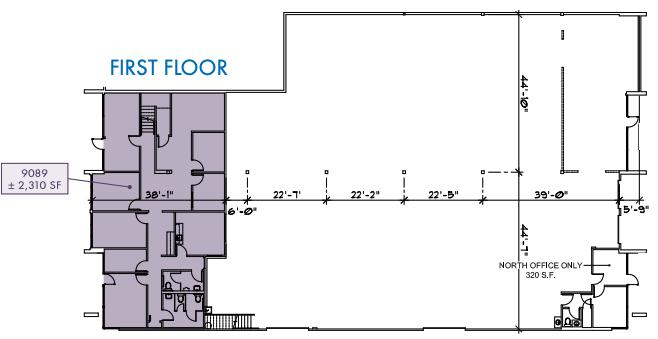
1-Mile | 3-Miles | 5-Miles | ||
---|---|---|---|---|
Total Population | 10,096 | 96,956 | 246,991 | |
Population Median Age | 37 | 40 | 39 | |
Population by Age | 0-9 Yrs | 1236 (12%) | 10733 (11%) | 28048 (11%) |
10-19 Yrs | 1382 (13%) | 11262 (11%) | 29067 (11%) | |
20-29 Yrs | 1652 (16%) | 13798 (14%) | 32024 (12%) | |
30-39 Yrs | 1512 (14%) | 14094 (14%) | 37777 (15%) | |
40-49 Yrs | 1009 (9%) | 11930 (12%) | 33436 (13%) | |
50-59 Yrs | 1186 (11%) | 11963 (12%) | 31728 (12%) | |
60-69 Yrs | 1222 (12%) | 11788 (12%) | 29361 (11%) | |
70+ Yrs | 897 (8%) | 11387 (11%) | 25551 (10%) | |
Median HH Income | $68,728 | $72,617 | $73,527 | |
Total Household Income | < 24K | 515 (13%) | 5051 (13%) | 13179 (13%) |
25-49K | 821 (21%) | 7220 (19%) | 17524 (18%) | |
50-74K | 707 (18%) | 7377 (19%) | 17781 (18%) | |
75-99K | 605 (16%) | 5556 (14%) | 13726 (14%) | |
100-199K | 888 (23%) | 9836 (25%) | 24451 (25%) | |
200K+ | 199 (5%) | 2844 (7%) | 8289 (8%) | |
Highest Education Level | No Diploma | 590 | 5299 | 14132 |
Diploma or GED | 1784 | 15773 | 36442 | |
Some College | 1955 | 18275 | 42432 | |
Assoc. Degree | 639 | 6578 | 15671 | |
Bachelors Degree | 1242 | 15117 | 42353 | |
Higher Degree | 592 | 7147 | 24064 | |
Total Housing Units | 3,898 | 39,157 | 98,778 | |
--Owner-Occupied | 1,960 | 24,038 | 62,177 | |
--Renter-Occupied | 1,775 | 13,846 | 32,774 | |
Owner-Occupied Values | < 100K | 268 | 2043 | 3587 |
100-199K | 84 | 1118 | 3487 | |
200-299K | 312 | 4889 | 12591 | |
300-399K | 763 | 7711 | 17787 | |
400-499K | 395 | 5072 | 11733 | |
500K+ | 139 | 3204 | 12993 | |
Total Working Age Population | 8,181 | 79,542 | 201,163 | |
In Work Force | 5,471 | 52,208 | 134,431 | |
Not In Work Force | 2,710 | 27,334 | 66,732 | |
Workforce Employed | 5,170 | 49,544 | 128,227 | |
Workforce Unemployed | 302 | 2,664 | 6,136 | |
Civlian Workforce | 5,471 | 52,208 | 134,363 | |
Military Workforce | 0 | 0 | 68 | |
Total Households | 3,735 | 37,884 | 94,951 | |
Family Households | 2,259 | 24,070 | 60,707 | |
Non-Family Households | 1,476 | 13,814 | 34,244 | |
Married Couple | 1,669 | 18,424 | 46,797 | |
Other Family | 590 | 5,647 | 13,910 | |
Married w/Child | 731 | 7,020 | 18,779 | |
Single Male w/Child | 63 | 845 | 2,053 | |
Single Female w/Child | 260 | 2,057 | 5,281 |
Population Change Last Two Decades - Plus Projection
2000 | % | 2010 | % | 2020 | % | 2030 | |
---|---|---|---|---|---|---|---|
Oregon | 3,421,399 | +12 | 3,831,074 | +11 | 4,264,810 | +11 | 4,727,438 |
Clackamas County | 338,391 | +11 | 375,992 | +14 | 428,860 | +14 | 490,011 |
Multnomah County | 660,486 | +11 | 735,334 | +12 | 822,675 | +10 | 906,904 |
Total Working Age Population:
Total Households:
Total Working Age Population:
Total Households:
Total Working Age Population:
Total Households: