Office Space
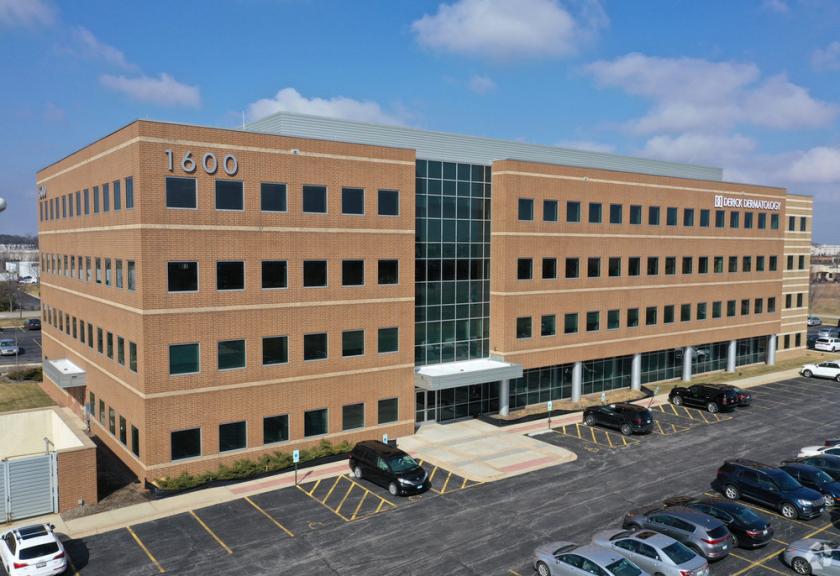
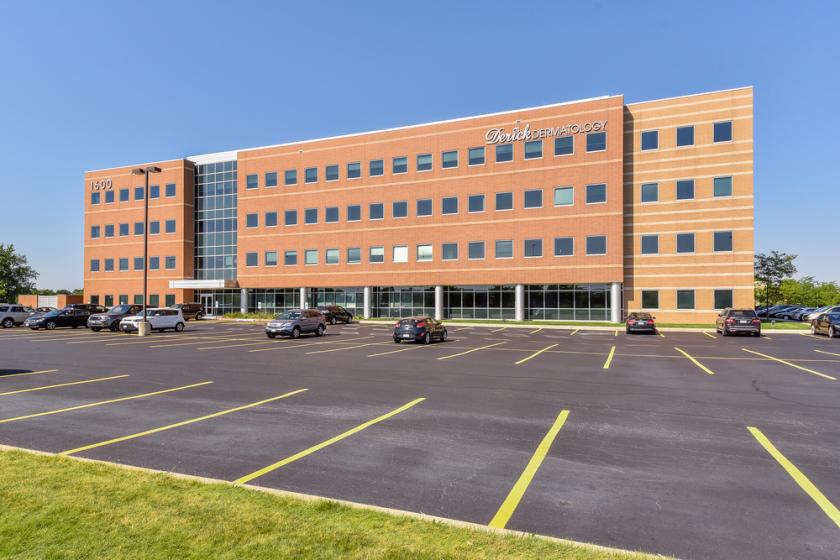
1600 North Randall Road Elgin, IL 60123
1600 North Randall Road Elgin, IL 60123
Details & Description
Property Highlights
- • Across from Advocate Sherman Hospital
- • Convenient access to I-90 and Randall Road
- • Immediate occupancy available
- • Building signage possible
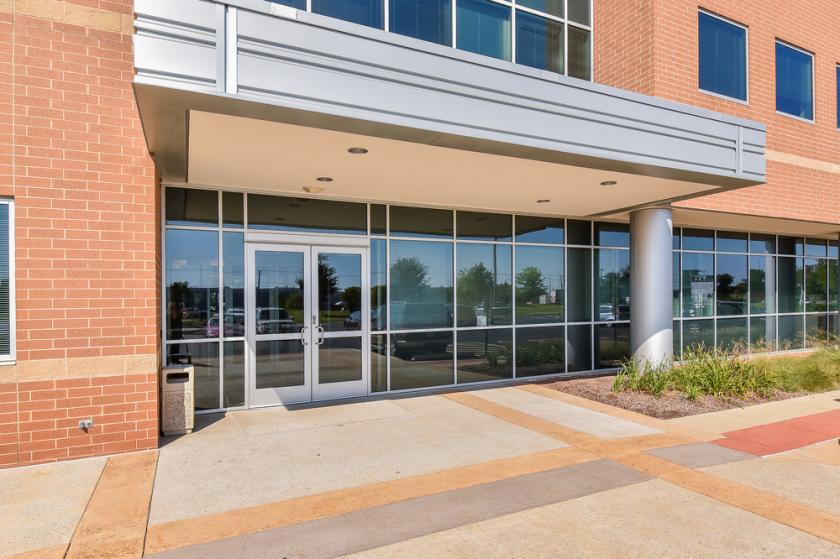
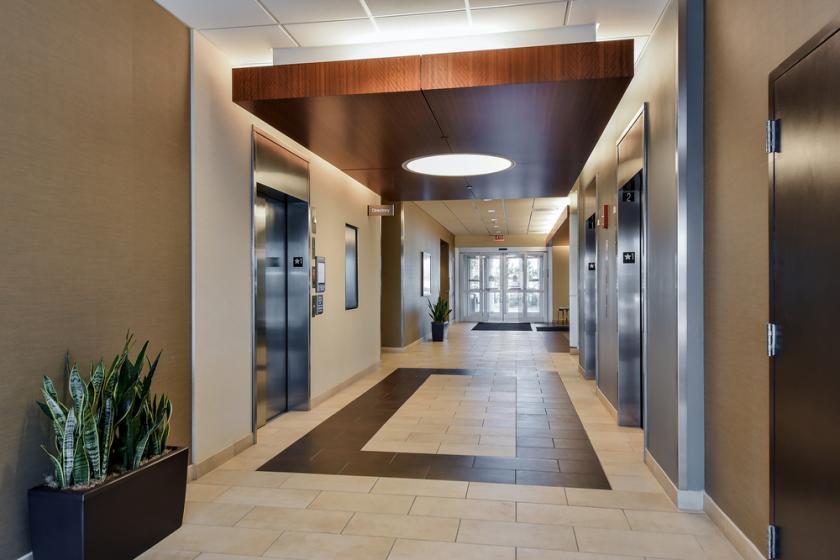
Additional Photos

Listing Agents

Kevin O'Donnell
O: 630-400-7327
M: 630-444-0444
kevin@odcre.com
O: 630-400-7327
M: 630-444-0444
kevin@odcre.com
While we strive to provide the most accurate information, all listing information, and demographic data, is provided by third-parties. As such, MyEListing will not be responsible for the accuracy of the information. It is strongly recommended that you verify all information with the listing agent, and any relevant agencies, prior to making any decisions.


