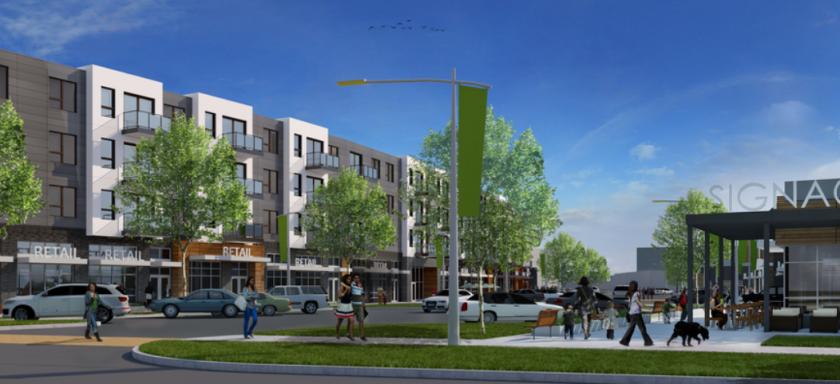
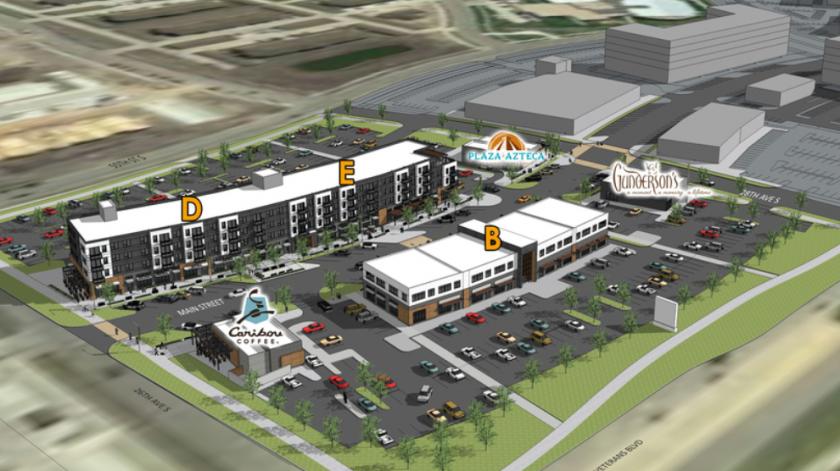
1-Mile | 3-Miles | 5-Miles | ||
---|---|---|---|---|
Total Population | 3,515 | 28,179 | 91,342 | |
Population Median Age | 34 | 36 | 36 | |
Population by Age | 0-9 Yrs | 456 (12%) | 4281 (15%) | 12683 (13%) |
10-19 Yrs | 485 (13%) | 3268 (11%) | 10132 (11%) | |
20-29 Yrs | 719 (20%) | 5022 (17%) | 19509 (21%) | |
30-39 Yrs | 450 (12%) | 4000 (14%) | 13346 (14%) | |
40-49 Yrs | 473 (13%) | 3209 (11%) | 9765 (10%) | |
50-59 Yrs | 486 (13%) | 3363 (11%) | 9792 (10%) | |
60-69 Yrs | 290 (8%) | 2875 (10%) | 8233 (9%) | |
70+ Yrs | 157 (4%) | 2162 (7%) | 7883 (8%) | |
Median HH Income | $97,067 | $78,697 | $60,791 | |
Total Household Income | < 24K | 96 (6%) | 1397 (11%) | 7225 (17%) |
25-49K | 172 (12%) | 2394 (20%) | 9405 (23%) | |
50-74K | 246 (17%) | 1818 (15%) | 7282 (18%) | |
75-99K | 200 (14%) | 1718 (14%) | 5882 (14%) | |
100-199K | 397 (28%) | 3100 (26%) | 7851 (19%) | |
200K+ | 270 (19%) | 1300 (11%) | 2651 (6%) | |
Highest Education Level | No Diploma | 22 | 506 | 3423 |
Diploma or GED | 233 | 2841 | 11552 | |
Some College | 307 | 3325 | 11995 | |
Assoc. Degree | 259 | 2461 | 8280 | |
Bachelors Degree | 896 | 6043 | 16564 | |
Higher Degree | 417 | 2550 | 6733 | |
Total Housing Units | 1,480 | 12,693 | 43,077 | |
--Owner-Occupied | 860 | 6,745 | 19,616 | |
--Renter-Occupied | 521 | 4,981 | 20,680 | |
Owner-Occupied Values | < 100K | 12 | 227 | 1074 |
100-199K | 97 | 1566 | 6857 | |
200-299K | 320 | 2473 | 6343 | |
300-399K | 192 | 1406 | 3139 | |
400-499K | 118 | 540 | 1077 | |
500K+ | 122 | 533 | 1126 | |
Total Working Age Population | 2,742 | 21,633 | 72,303 | |
In Work Force | 2,228 | 16,695 | 54,986 | |
Not In Work Force | 514 | 4,938 | 17,318 | |
Workforce Employed | 2,194 | 16,380 | 53,287 | |
Workforce Unemployed | 29 | 257 | 1,537 | |
Civlian Workforce | 2,223 | 16,637 | 54,824 | |
Military Workforce | 5 | 58 | 162 | |
Total Households | 1,381 | 11,726 | 40,296 | |
Family Households | 908 | 7,355 | 22,147 | |
Non-Family Households | 473 | 4,371 | 18,149 | |
Married Couple | 800 | 5,895 | 16,642 | |
Other Family | 108 | 1,460 | 5,505 | |
Married w/Child | 385 | 2,606 | 7,113 | |
Single Male w/Child | 18 | 298 | 1,098 | |
Single Female w/Child | 46 | 740 | 2,603 |
Population Change Last Two Decades - Plus Projection
2000 | % | 2010 | % | 2020 | % | 2030 | |
---|---|---|---|---|---|---|---|
Minnesota | 4,919,479 | +8 | 5,303,925 | +7 | 5,687,161 | +5 | 5,974,304 |
Clay County | 51,229 | +15 | 58,999 | +9 | 64,292 | +5 | 67,623 |
North Dakota | 642,200 | +5 | 672,591 | +23 | 824,344 | +13 | 931,506 |
Cass County | 123,138 | +22 | 149,778 | +26 | 188,810 | +14 | 214,719 |
Total Working Age Population:
Total Households:
Total Working Age Population:
Total Households:
Total Working Age Population:
Total Households: