Industrial Properties
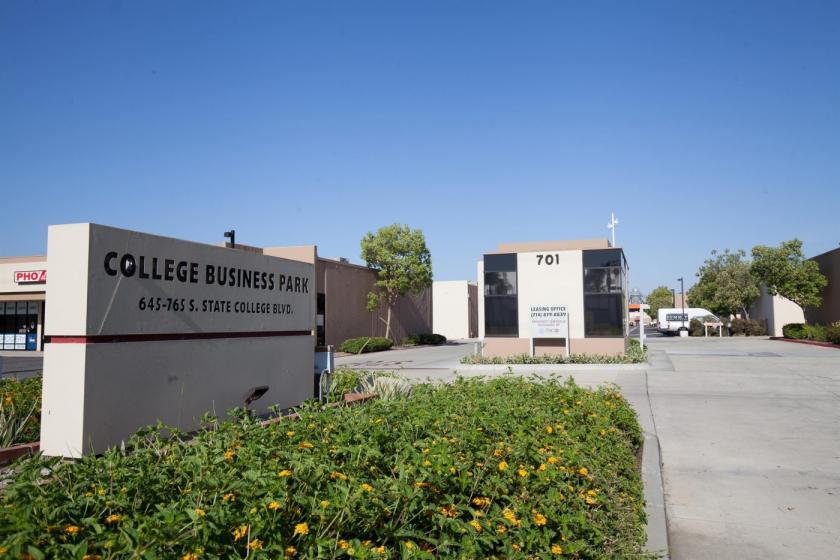
645 South State College Boulevard Fullerton, CA 92831
645 South State College Boulevard Fullerton, CA 92831
Details & Description
Property Highlights
- • Full Commission
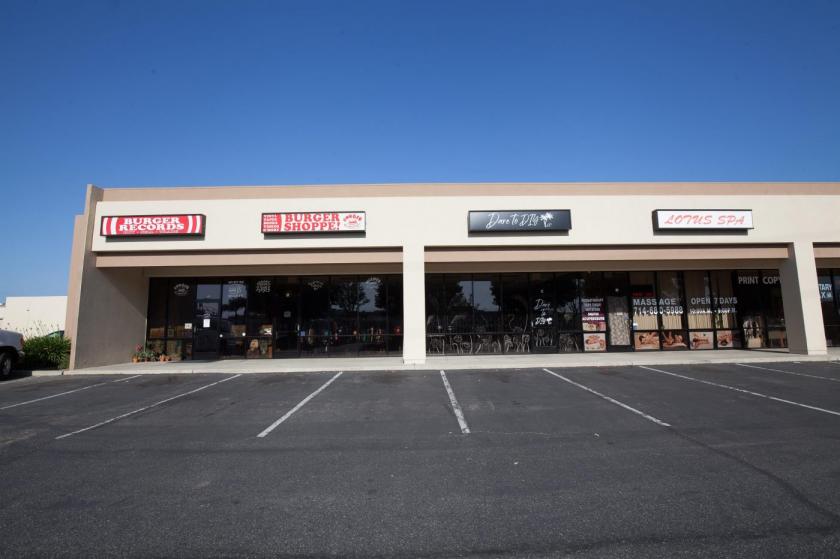
- • Flex SpaceRetail
- • Canned Facade Signage
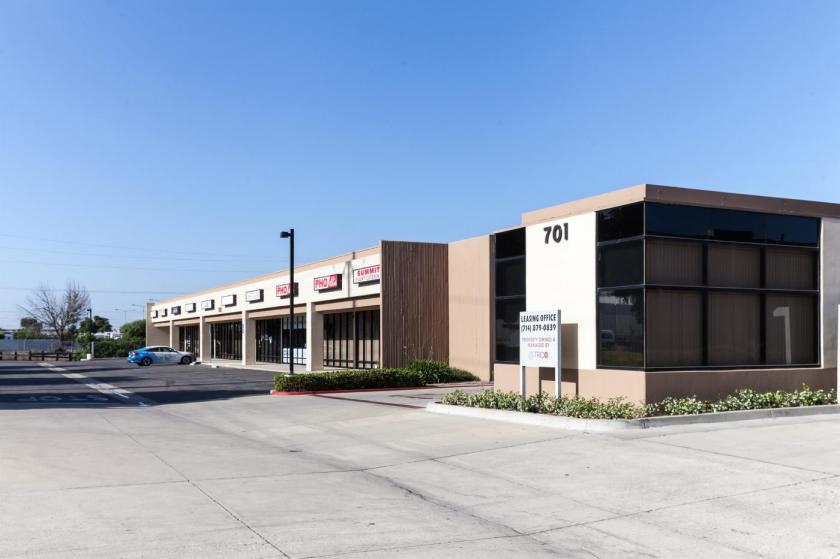
- • Street front, off of State College Blvd
- • 15k traffic count
Additional Photos
Listing Agents

John Pak
O: 714-751-4420
john@tricorealty.com
O: 714-751-4420
john@tricorealty.com
While we strive to provide the most accurate information, all listing information, and demographic data, is provided by third-parties. As such, MyEListing will not be responsible for the accuracy of the information. It is strongly recommended that you verify all information with the listing agent, and any relevant agencies, prior to making any decisions.


