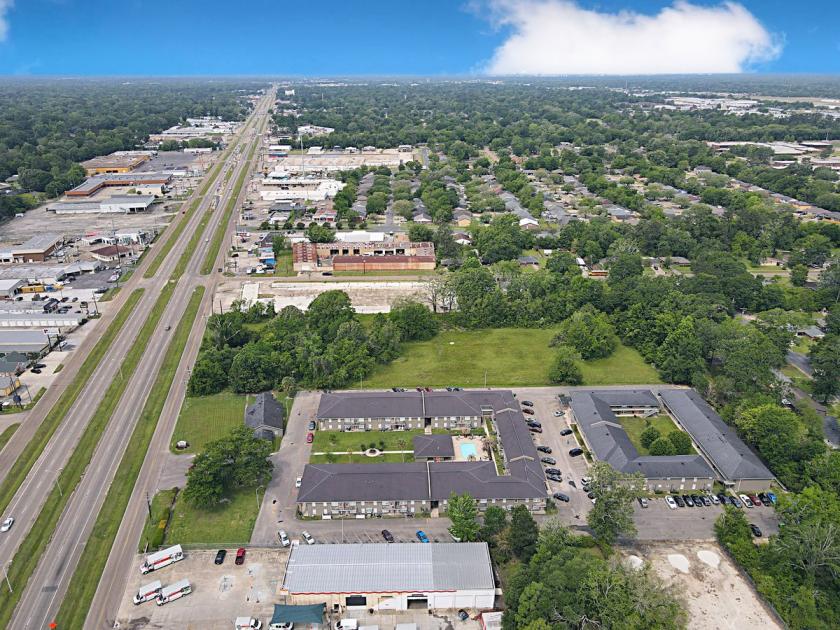
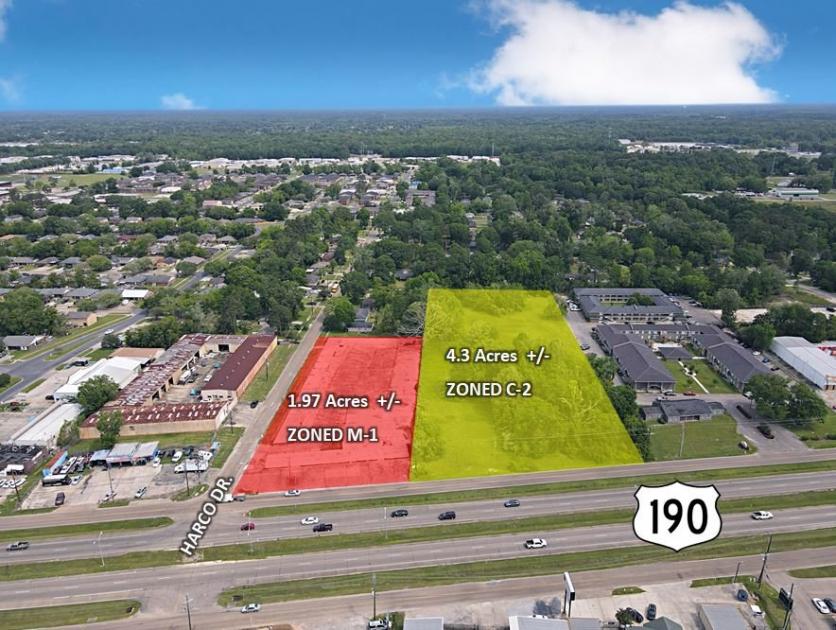
1-Mile | 3-Miles | 5-Miles | ||
---|---|---|---|---|
Total Population | 11,905 | 68,676 | 147,015 | |
Population Median Age | 34 | 36 | 38 | |
Population by Age | 0-9 Yrs | 1736 (14%) | 9797 (14%) | 19253 (13%) |
10-19 Yrs | 1952 (16%) | 8809 (12%) | 18378 (12%) | |
20-29 Yrs | 2158 (18%) | 11682 (17%) | 23393 (15%) | |
30-39 Yrs | 1762 (14%) | 9863 (14%) | 22105 (15%) | |
40-49 Yrs | 1269 (10%) | 7729 (11%) | 15967 (10%) | |
50-59 Yrs | 1203 (10%) | 7628 (11%) | 17288 (11%) | |
60-69 Yrs | 1005 (8%) | 6729 (9%) | 15719 (10%) | |
70+ Yrs | 820 (6%) | 6438 (9%) | 14912 (10%) | |
Median HH Income | $52,874 | $55,020 | $58,418 | |
Total Household Income | < 24K | 978 (25%) | 4680 (18%) | 10655 (19%) |
25-49K | 831 (21%) | 6579 (26%) | 13707 (24%) | |
50-74K | 1029 (26%) | 4902 (19%) | 9829 (17%) | |
75-99K | 400 (10%) | 3034 (12%) | 6971 (12%) | |
100-199K | 550 (14%) | 4931 (19%) | 11996 (21%) | |
200K+ | 76 (1%) | 633 (2%) | 2767 (4%) | |
Highest Education Level | No Diploma | 1037 | 3623 | 8229 |
Diploma or GED | 2662 | 13641 | 27383 | |
Some College | 1784 | 11486 | 24455 | |
Assoc. Degree | 386 | 2899 | 5614 | |
Bachelors Degree | 1049 | 8844 | 21703 | |
Higher Degree | 407 | 3798 | 10466 | |
Total Housing Units | 4,661 | 29,404 | 65,023 | |
--Owner-Occupied | 2,315 | 15,877 | 34,224 | |
--Renter-Occupied | 1,549 | 8,881 | 21,701 | |
Owner-Occupied Values | < 100K | 496 | 1813 | 3449 |
100-199K | 1311 | 9997 | 16231 | |
200-299K | 462 | 3130 | 9191 | |
300-399K | 24 | 615 | 2990 | |
400-499K | 0 | 91 | 995 | |
500K+ | 21 | 231 | 1368 | |
Total Working Age Population | 9,036 | 53,679 | 116,878 | |
In Work Force | 5,953 | 36,293 | 78,531 | |
Not In Work Force | 3,082 | 17,386 | 38,346 | |
Workforce Employed | 5,516 | 34,337 | 74,649 | |
Workforce Unemployed | 438 | 1,905 | 3,770 | |
Civlian Workforce | 5,953 | 36,242 | 78,419 | |
Military Workforce | 0 | 52 | 113 | |
Total Households | 3,864 | 24,758 | 55,924 | |
Family Households | 2,670 | 15,234 | 33,742 | |
Non-Family Households | 1,194 | 9,525 | 22,183 | |
Married Couple | 1,470 | 9,174 | 22,053 | |
Other Family | 1,200 | 6,059 | 11,689 | |
Married w/Child | 687 | 3,355 | 7,900 | |
Single Male w/Child | 172 | 653 | 1,251 | |
Single Female w/Child | 420 | 2,277 | 4,644 |
Population Change Last Two Decades - Plus Projection
2000 | % | 2010 | % | 2020 | % | 2030 | |
---|---|---|---|---|---|---|---|
Louisiana | 4,468,976 | +1 | 4,533,372 | +1 | 4,588,310 | +5 | 4,813,420 |
East Baton Rouge Parish | 412,852 | +7 | 440,171 | -3 | 426,380 | -1 | 421,500 |
Iberville Parish | 33,320 | 0 | 33,387 | -17 | 27,830 | -11 | 24,640 |
Livingston Parish | 91,814 | +39 | 128,026 | +40 | 179,820 | +35 | 242,780 |
St. Martin Parish | 48,583 | +7 | 52,160 | +6 | 55,520 | +3 | 57,000 |
Total Working Age Population:
Total Households:
Total Working Age Population:
Total Households:
Total Working Age Population:
Total Households: