Commercial Land
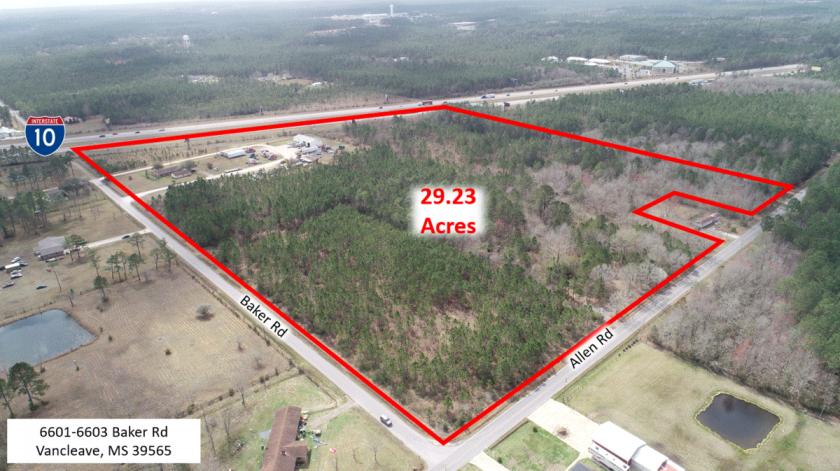
6601 Baker Road Vancleave, MS 39565
6601 Baker Road Vancleave, MS 39565
Details & Description
Property Highlights
- • Interstate 10 Frontage
- • Access Via Allen Rd Baker Rd
- • Part Of Interstate 10 Frontage Is Cleared
- • Not In Flood Zone
- • City Road Recently Repaved
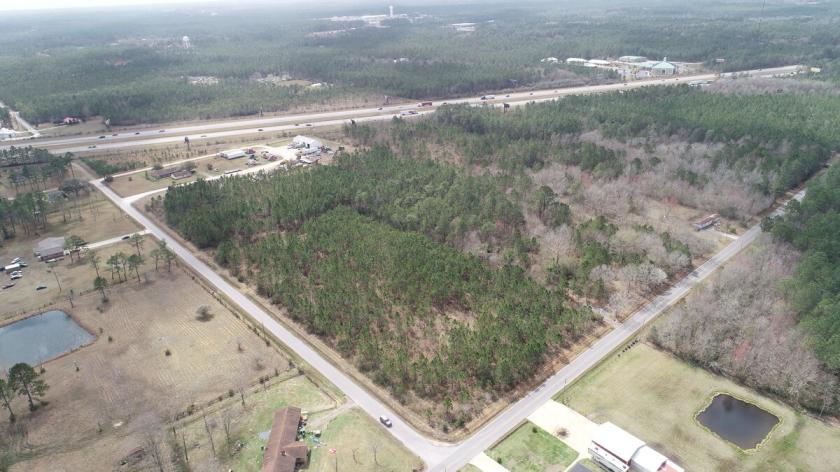
Additional Photos


Listing Agents

Beau Box
O: 225-237-3343
bbox@beaubox.com
O: 225-237-3343
bbox@beaubox.com
While we strive to provide the most accurate information, all listing information, and demographic data, is provided by third-parties. As such, MyEListing will not be responsible for the accuracy of the information. It is strongly recommended that you verify all information with the listing agent, and any relevant agencies, prior to making any decisions.


