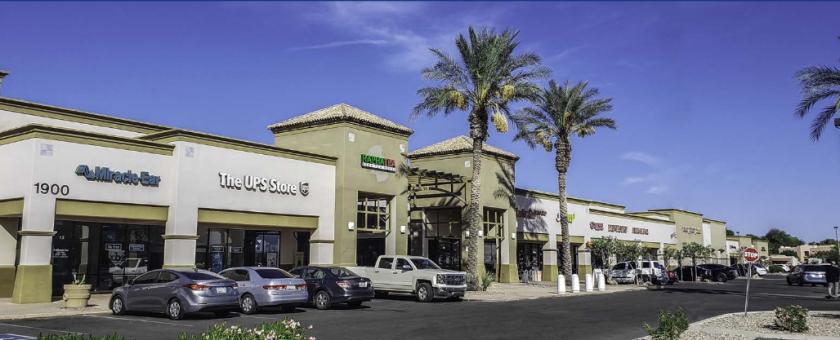
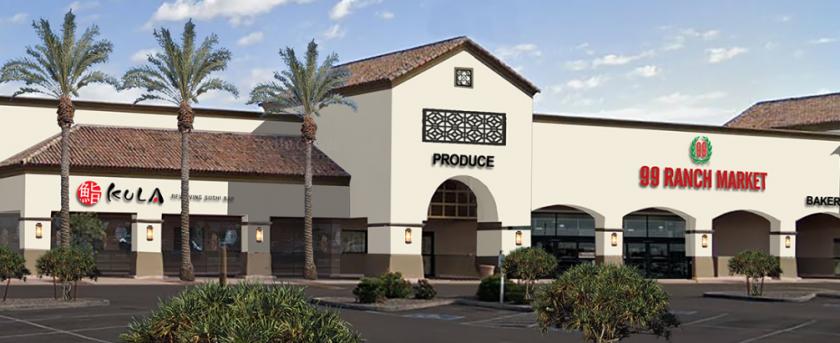
Retail Space
1995 West Chandler Boulevard Chandler, AZ 85224
1995 West Chandler Boulevard Chandler, AZ 85224
Details & Description
Property Highlights
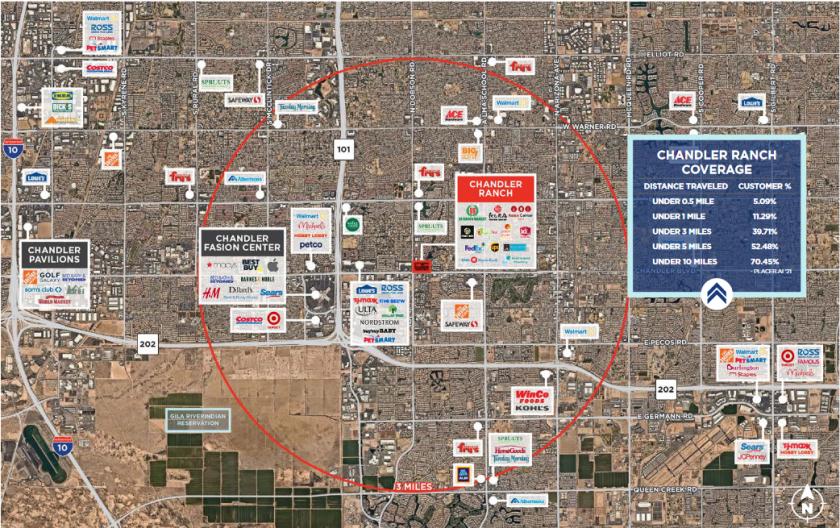
- • HIGHLY ACCESSIBLE FROM LOOP 101 AND 202
- • 525,000 WORKERS within a 10 MILE RADIUS
- • Chandler is the SELF-DRIVING CAPITAL OF THE WORLD
Listing Agents

Naoyuki Kondo
New Quest Properties
O: 281-477-4365
nkondo@newquest.com
New Quest Properties
O: 281-477-4365
nkondo@newquest.com
While we strive to provide the most accurate information, all listing information, and demographic data, is provided by third-parties. As such, MyEListing will not be responsible for the accuracy of the information. It is strongly recommended that you verify all information with the listing agent, and any relevant agencies, prior to making any decisions.