Retail Space
9292 Warren Parkway Frisco, TX 75035
9292 Warren Parkway Frisco, TX 75035
Details & Description
Property Highlights
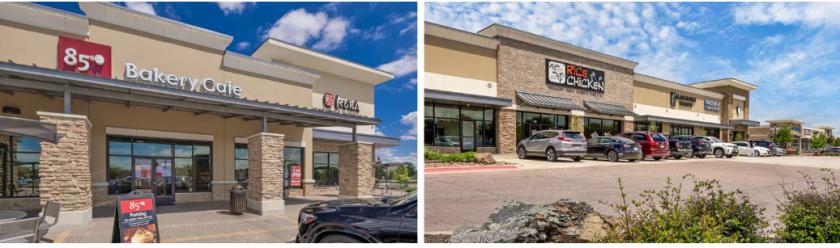
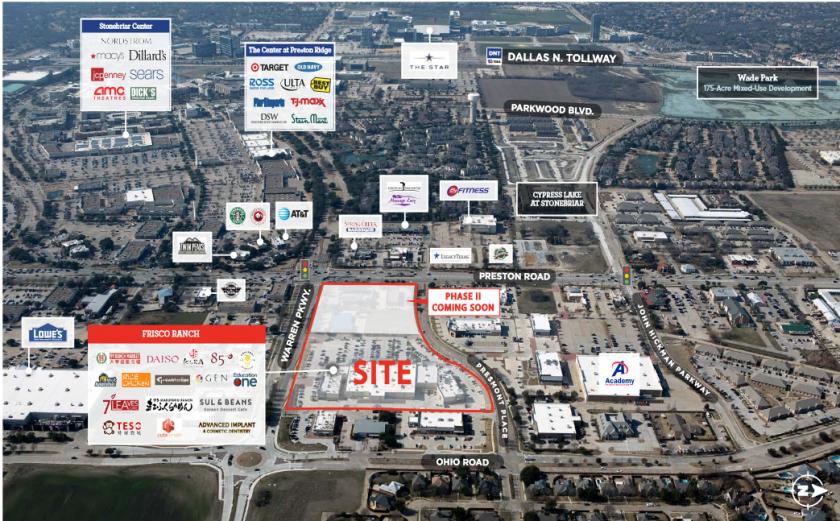
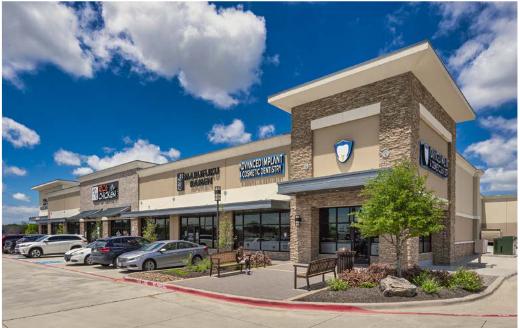
• 100,000 SF new Asian themed development located in the heart of Friscos retail hub at the NEC of Preston Road and Warre
• Frisco is known for exemplary schools, pristine parks and destination dining yet also has great retail, sports and ente
Listing Agents

Naoyuki Kondo
New Quest Properties
O: 281-477-4365
nkondo@newquest.com
New Quest Properties
O: 281-477-4365
nkondo@newquest.com
While we strive to provide the most accurate information, all listing information, and demographic data, is provided by third-parties. As such, MyEListing will not be responsible for the accuracy of the information. It is strongly recommended that you verify all information with the listing agent, and any relevant agencies, prior to making any decisions.