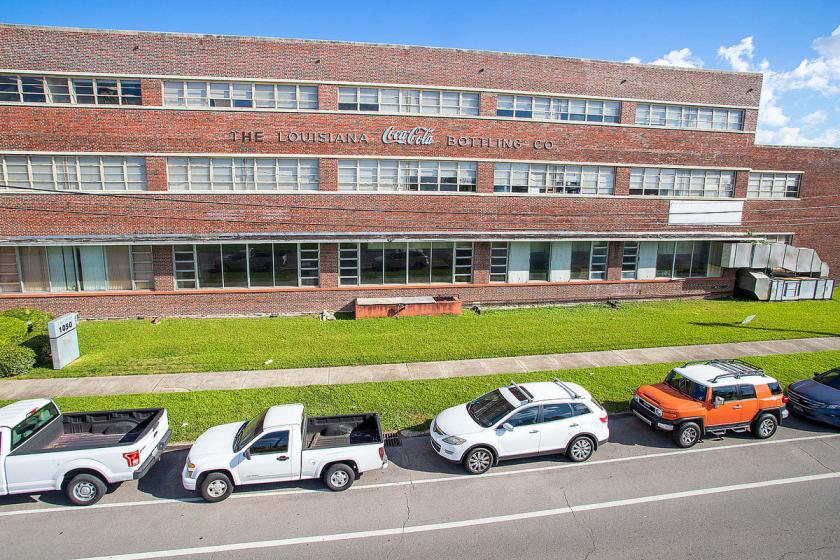
Retail Space
1050 South Norman C Francis Parkway New Orleans, LA 70125
1050 South Norman C Francis Parkway New Orleans, LA 70125
Details & Description
Property Highlights
- • Offering Memorandum available upon request.
- • Ground floor retail up to 45,000 square feet
- • Ample on-site parking
- • Rent is negotiable depending on buildout and size
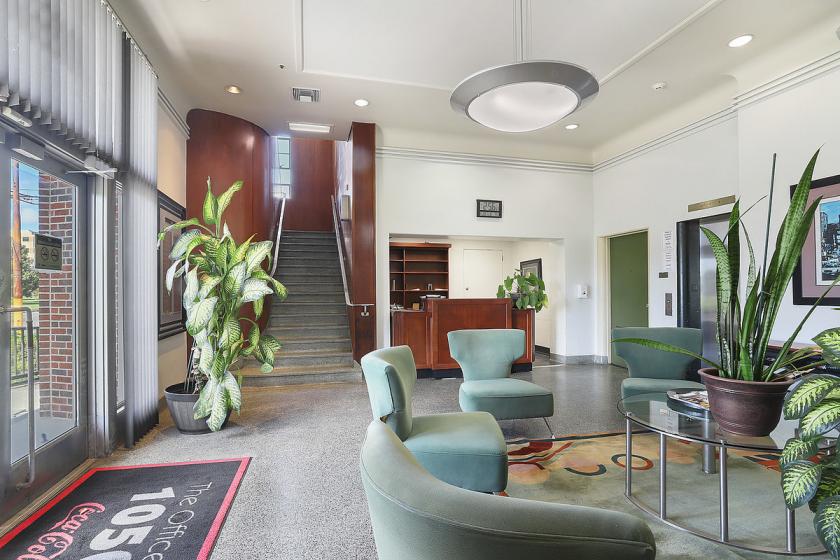
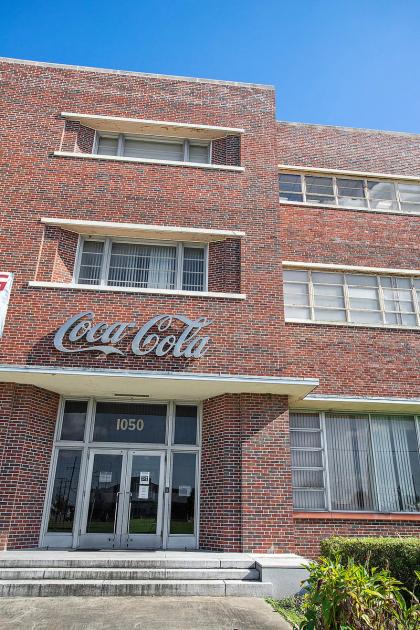
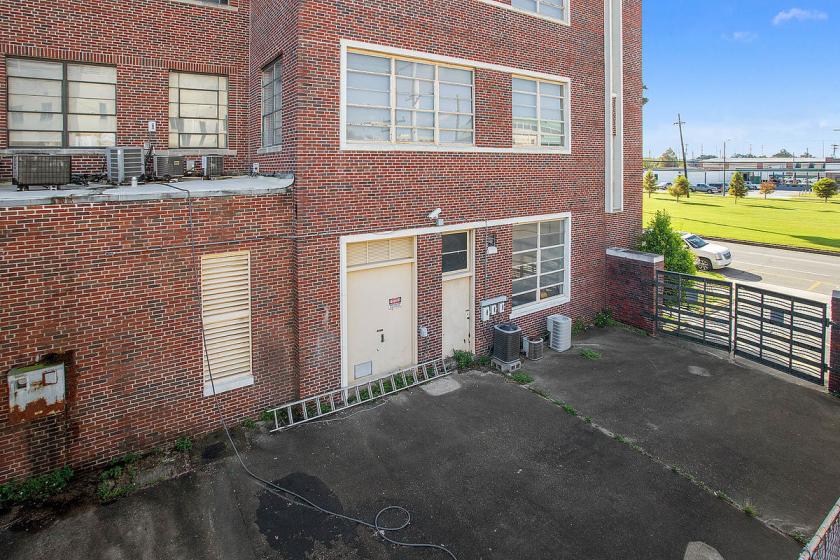
Additional Photos

Listing Agents

Beau Box
O: 225-237-3343
bbox@beaubox.com
O: 225-237-3343
bbox@beaubox.com
While we strive to provide the most accurate information, all listing information, and demographic data, is provided by third-parties. As such, MyEListing will not be responsible for the accuracy of the information. It is strongly recommended that you verify all information with the listing agent, and any relevant agencies, prior to making any decisions.


