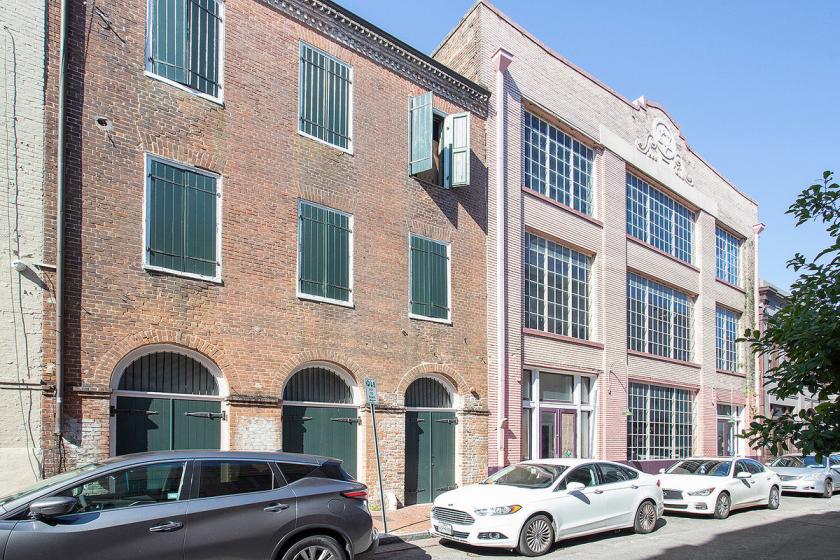
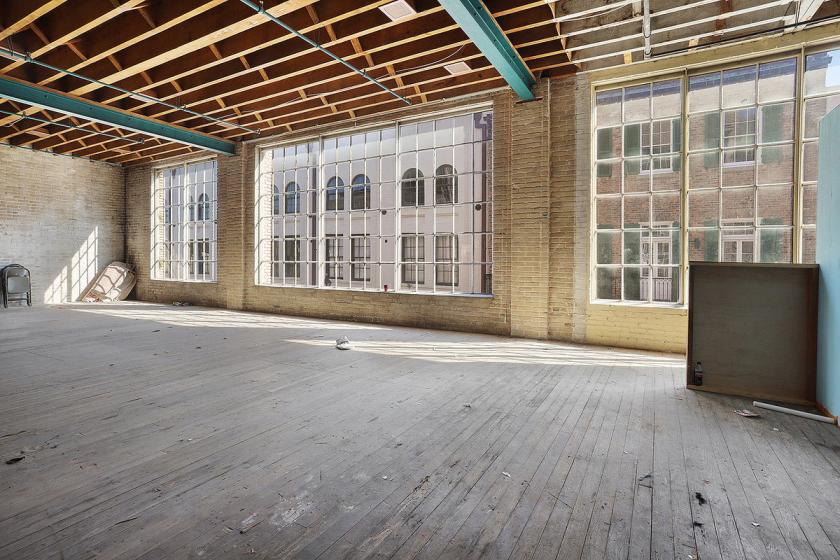
Retail Space
517 Toulouse Street New Orleans, LA 70130
517 Toulouse Street New Orleans, LA 70130
Details & Description
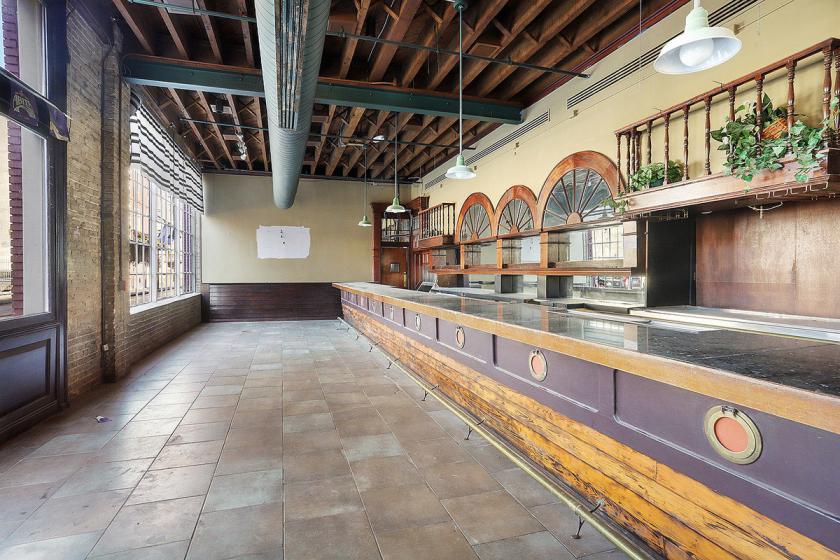
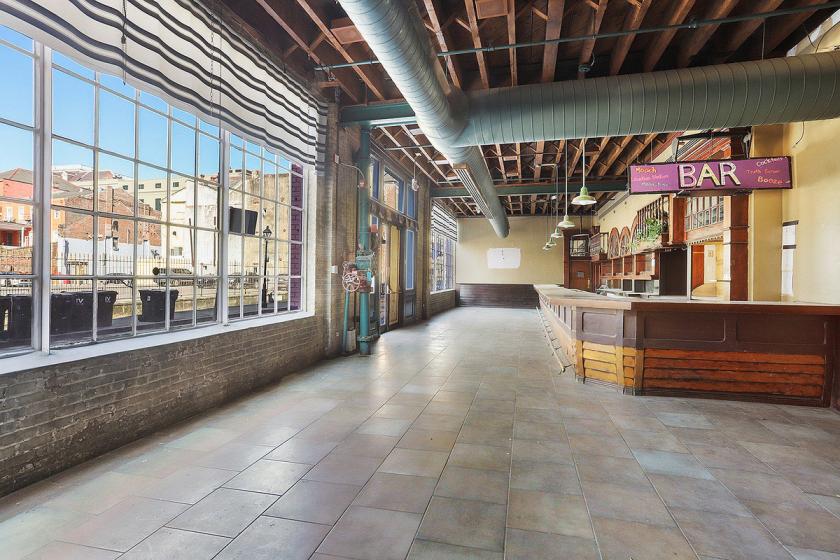
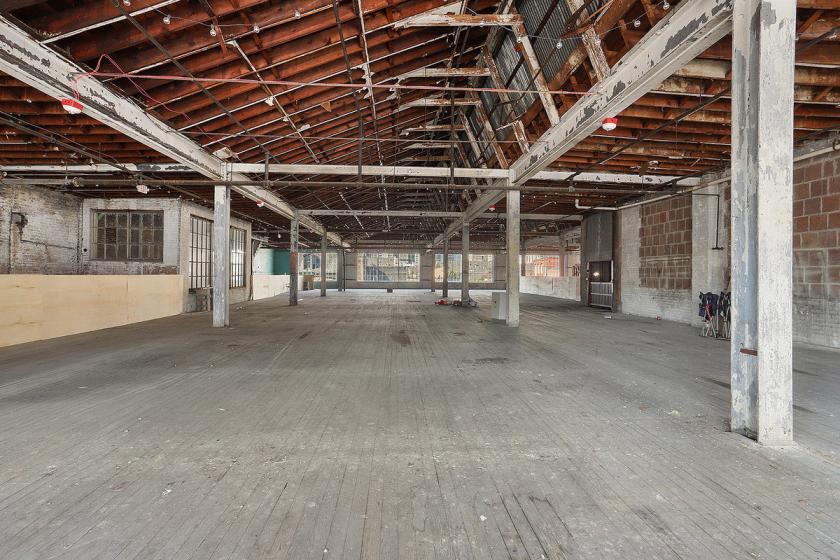
Additional Photos
Listing Agents

Liam Grace
O: 504-812-1214
lgrace@beaubox.com
O: 504-812-1214
lgrace@beaubox.com

Beau Box
O: 225-237-3343
bbox@beaubox.com
O: 225-237-3343
bbox@beaubox.com
While we strive to provide the most accurate information, all listing information, and demographic data, is provided by third-parties. As such, MyEListing will not be responsible for the accuracy of the information. It is strongly recommended that you verify all information with the listing agent, and any relevant agencies, prior to making any decisions.


